


Stock Market Breakdown May Extend Deeper If Support Is Broken
Stock-Markets / Stock Markets 2020 Nov 02, 2020 - 11:19 AM GMTBy: Chris_Vermeulen

The breakdown in the markets last week may have caught some traders off guard and resulted in a few stressful days. As much as we want to tell you the selling is over, my researchers and I believe the selling may continue for a bit longer as the election and uncertainty related to COVID-19, global economics and post election stimulus and US government issues continue to plague future growth expectations.
We’re presenting these custom index charts today to help you understand where key support levels are in the broader market and to help you understand what to expect if this selling continues. Over the past few weeks, we’ve published a number of research articles that provide important background and context to this article, including our research on the SPY Dark Cloud Cover pattern, NASDAQ E-minis Futures support levels, and what we see in store for prices of Gold and Silver.
One of the tools we use, in conjunction with our proprietary indicators, price modeling, and trading systems is our Custom Index charts. These charts help us to gauge and understand market price activity as well as to help quantify the scale and scope of recent trends. For example, we use these charts (and others) to better understand where, when, and how the underlying facets of the markets are shifting. Often times, this allows us to see how the mechanics of the markets are working before the outcome really starts to become evident.
CUSTOM VALUATIONS INDEX
The first chart we will look at is the Custom Valuations Index Weekly chart, below. It is designed to show us how and where price valuations levels are trending. Pay attention to the Double-Top pattern that recently set up near 520 and the Pennant/Flag formation that Apexed in early September. Notice how that setup prompted a moderately stagnant few weeks of sideways trading before the broad market breakdown started to trend.
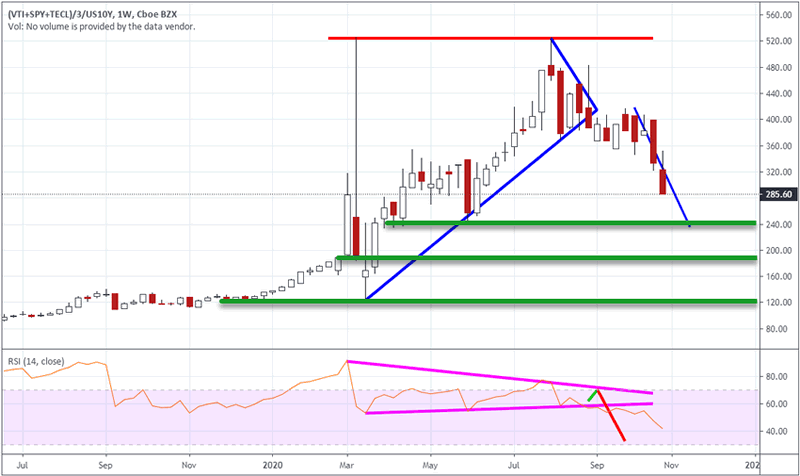
One interesting facet about this chart is that it actually started to break down very hard five weeks ago. Think about that interesting facet for a minute. The markets were rallying just 3 weeks ago and many traders were jumping back into the markets expecting the rally to continue. But our Custom Valuations Index chart was suggesting the markets were continuing to weaken. Then came the breakdown over the last 2+ weeks
CUSTOM US STOCK MARKET INDEX
This next chart shows the Custom US Stock Market Index Weekly chart and clearly shows the new recent high price level (just three weeks ago) has completely broken down at this point. When we take into consideration the Custom Valuations Index chart and this Custom US Stock Market chart, we start to see a broad market picture that suggests selling may continue to attempt to reach the support levels we’ve drawn on these charts. If the US elections and post-election global market event prompt more fear and uncertainty, then we see only one process taking over – price revaluation.
We believe support levels that we’ve highlighted on these charts will likely prompt some moderately strong attempts at supporting a bottom/base in the markets. But the downside risk depends on the actions taken by traders and governments related to the fear and uncertainty that may permeate global market sentiment.
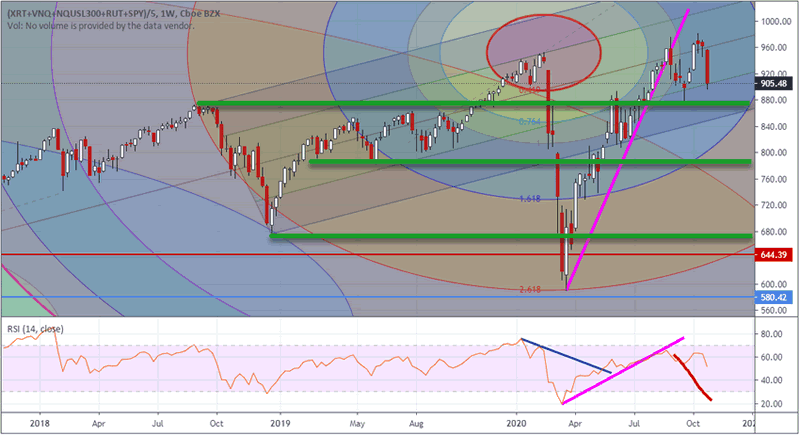
Take another look at the Custom Valuations Index Chart, above, and focus on the two lower support levels. Both of these price levels from late 2019 and early 2020 as key support levels. Thus, our Custom US Stock Market Index chart suggests support may be found near 775 or 655 – these represent levels on this Custom US Stock Market Index Chart that correlate to the Custom Valuations Index Chart support levels. We’ve translated the levels from the Valuations chart to the US Stock Market chart.
CUSTOM SMART CASH INDEX
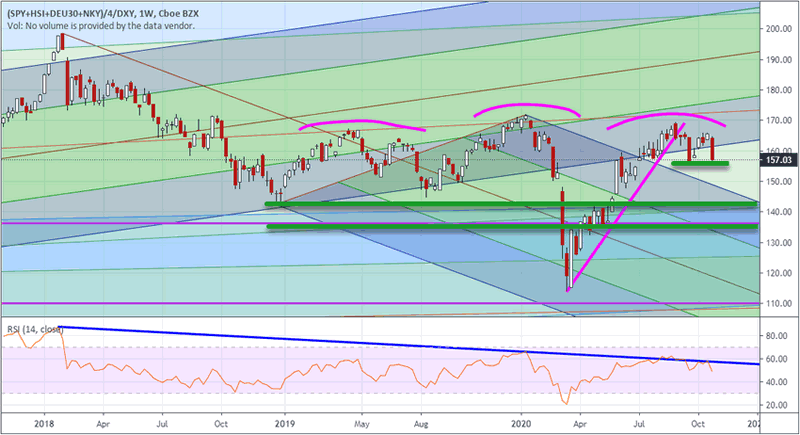
Lastly, we also pay close attention to the Custom Smart Cash Index Weekly chart below. It shows the “true price peak” in January/February 2018 and shows how the recent price highs on the Custom US Stock Market Index chart were really “false highs” resulting from an “excess phase” in the markets. This happens when speculators and outside events prop-up the market price levels while true organic growth stalls. That is what we believe the Custom Smart Cash Index chart is showing us (compared to the Custom US Stock Market Index chart).
When the Custom Smart Cash and Custom US Stock Market Indexes are moving in unison, then we are seeing true organic economic and price growth. When they diverge, as you can see in these two examples, we believe a different type of market phase has setup. In this case, an “Excess Phase” setup in early 2019 (just after the US Fed reversed course after an ill-fated rate increase in October 2018). That is what we believe started the current transition in the markets and what is now, potentially, ending.
Support levels on this Smart Cash Index chart suggest 155, 143 and 136 are critical support areas for the market. Below these levels on this chart, the markets may attempt to retest recent COVID-19 lows. On the SPY, these support levels translate to : 320.25, 299.00, and 278.50.
We believe this week will be very volatile and wild because of the US Presidential elections. We believe the recent breakdown in the markets, as you can see on these charts, needs to find immediate support above $299 on the SPY – quickly. If this does not happen, then we may be entering a much broader downside market trend.
We highlighted a Dark Cloud Cover pattern on the Monthly SPY chart about 35 days ago which has now confirmed. There have been instances where this type of topping/sell signal pattern is immediately reversed by a strong rally, but right now we are uncertain that is likely to happen. Too many factors are aligning to suggest a broader downside move is pending.
Still, we understand the real risks of the market and also understand that by the time early 2021 trading starts to unfold, many of these concerns will likely be behind us. Our predictive modeling systems are suggesting a moderately strong Christmas rally is likely to close our 2020. This, we may see a very quick downside move followed by a moderately strong Christmas recovery. Therefore, we are eager to see how the next few weeks and months play out as we see many incredible opportunities for traders on the horizon.
If you want to survive trading these markets then you learn fairly quickly how important it is to protect against risk and to properly size your trades. My research team and I are here to help you find better trades and navigate these incredibly crazy market trends. We can also help you preserve and even grow your long-term capital with our signals that tell you when long-term trends are starting and ending. Don’t wait until it is too late – find out more at www.TheTechnicalTraders.com.
Chris Vermeulen
www.TheTechnicalTraders.com
Chris Vermeulen has been involved in the markets since 1997 and is the founder of Technical Traders Ltd. He is an internationally recognized technical analyst, trader, and is the author of the book: 7 Steps to Win With Logic
Through years of research, trading and helping individual traders around the world. He learned that many traders have great trading ideas, but they lack one thing, they struggle to execute trades in a systematic way for consistent results. Chris helps educate traders with a three-hour video course that can change your trading results for the better.
His mission is to help his clients boost their trading performance while reducing market exposure and portfolio volatility.
He is a regular speaker on HoweStreet.com, and the FinancialSurvivorNetwork radio shows. Chris was also featured on the cover of AmalgaTrader Magazine, and contributes articles to several leading financial hubs like MarketOracle.co.uk
Disclaimer: Nothing in this report should be construed as a solicitation to buy or sell any securities mentioned. Technical Traders Ltd., its owners and the author of this report are not registered broker-dealers or financial advisors. Before investing in any securities, you should consult with your financial advisor and a registered broker-dealer. Never make an investment based solely on what you read in an online or printed report, including this report, especially if the investment involves a small, thinly-traded company that isn’t well known. Technical Traders Ltd. and the author of this report has been paid by Cardiff Energy Corp. In addition, the author owns shares of Cardiff Energy Corp. and would also benefit from volume and price appreciation of its stock. The information provided here within should not be construed as a financial analysis but rather as an advertisement. The author’s views and opinions regarding the companies featured in reports are his own views and are based on information that he has researched independently and has received, which the author assumes to be reliable. Technical Traders Ltd. and the author of this report do not guarantee the accuracy, completeness, or usefulness of any content of this report, nor its fitness for any particular purpose. Lastly, the author does not guarantee that any of the companies mentioned in the reports will perform as expected, and any comparisons made to other companies may not be valid or come into effect.
Chris Vermeulen Archive |
© 2005-2022 http://www.MarketOracle.co.uk - The Market Oracle is a FREE Daily Financial Markets Analysis & Forecasting online publication.