


More Short-term Stock Market Weakness Ahead
Stock-Markets / Stock Markets 2020 Oct 20, 2020 - 02:26 PM GMTBy: Andre_Gratian

Current Position of the Market
SPX Long-term trend: For now, the best guesstimate is that we are still in the bull market which started in 2009. Where we go from here and how far will be gauged after the September-October correction.
SPX Intermediate trend: Intermediate correction nearly over?
Analysis of the short-term trend is done daily with the help of hourly charts. It is an important adjunct to the analysis of daily and weekly charts which discuss longer market trends.
Daily market analysis of the short-term trend is reserved for subscribers. If you would like to sign up for a FREE 4-week trial period of daily comments, please let me know at anvi1962@cableone.net
More Short-term Weakness Ahead
Cycles: Looking ahead! 90-yr cycle – last low: 1932. Next low: 2022
7-yr cycle – last low: 2016. Next low: 2023
Nest of short-term cycle lows on about 10/15-20 (currently driving short-term market action)
Market Analysis (Charts courtesy of QCharts
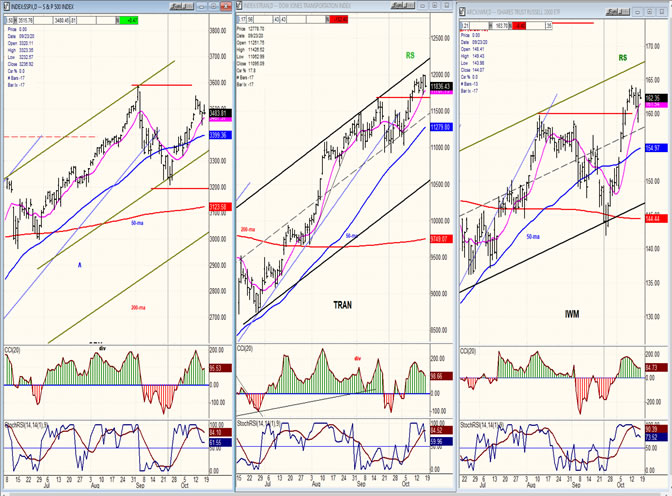
SPX-TRAN- IWM – daily charts
The minor correction of the past few days has not affected the relative standing of the SPX vs. its leading indicators. The inference remains the same: while we could go through a period of consolidation, it should be followed by a resumption of the uptrend.
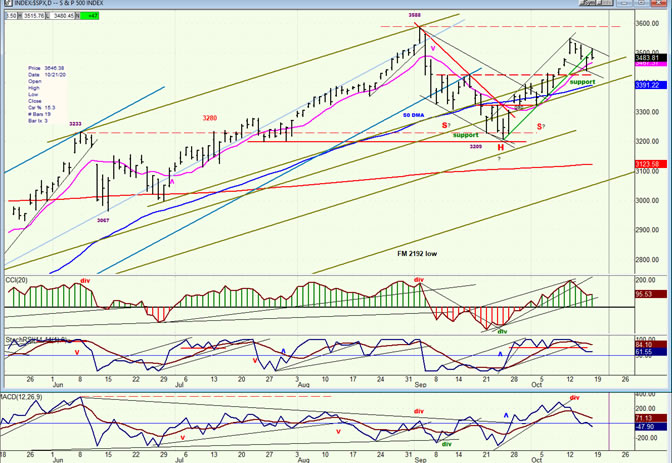
SPX daily chart
After a strong uptrend from its March low of 2192 which stopped just shy of 3600, SPX had a mild correction down to an area of support, and rallied without being able to exceed its recent all-time high. Last week’s pull-back found support just above the short term break-out level of 3430 and bounced but, judging by Friday’s action, the current minor correction does not look complete.
There is a strong level of support at 3430 denoted on the chart by a dashed line which could turn out to be the neck- line of a reverse H&S pattern. Since the tendency in such a pattern is for the break-out above the neckline to be completely retraced, and since our correction did not quite do it last Thursday, it’s likely that we’ll try again next week before resuming the uptrend.
Before going any farther, it should be mentioned that H&S patterns have a high rate of failure, as they often morph into some other market pattern. If this does turn out to be one, we could see the next short term uptrend carrying the SPX to ~3650; but be aware that this is only theoretical until we have determined that this is truly an H&S bottom.
The oscillators are confirming that the index is in a corrective move.
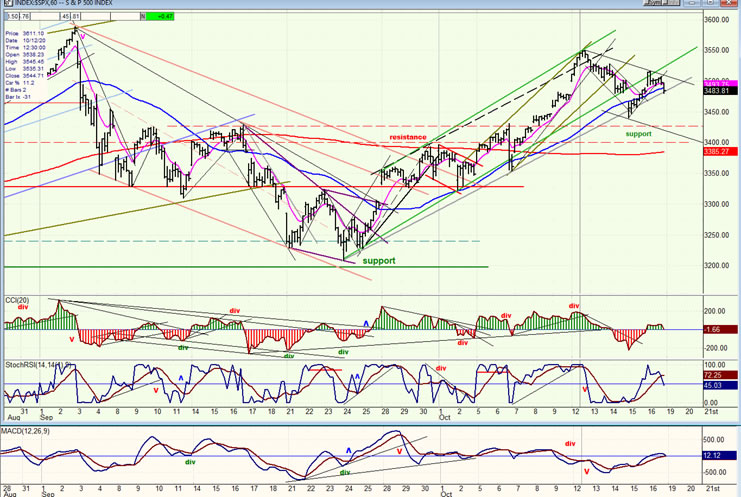
- SPX hourly chart
- The uptrend from the 3200 low consisted of two closely interwoven price channels: the narrower green channel and the slightly broader grey channel. The uptrend ended at the top channel line of the green channel and the first leg of the correction went outside the green channel bottom line but held on that of the grey channel. The bounce from that point took the SPX back to the broken channel line of the green channel, from which it retraced immediately back to the broader channel support line.
- If it goes outside of the latter, we can assume that the correction from 3550 is continuing, perhaps extending all the way down to the bottom of the minor channel drawn on the chart. There it would also find support from the band of congestion between 3400 and 3430, as well as from the 200-dma which is running at about 3385.
- After moving higher at the beginning of Friday’s session, the indicators fell back into the close, reflecting the price movement. This appears to suggest that there should be some follow-through on Monday morning, especially since all of the minor cycles discussed above have yet to make their lows.
-
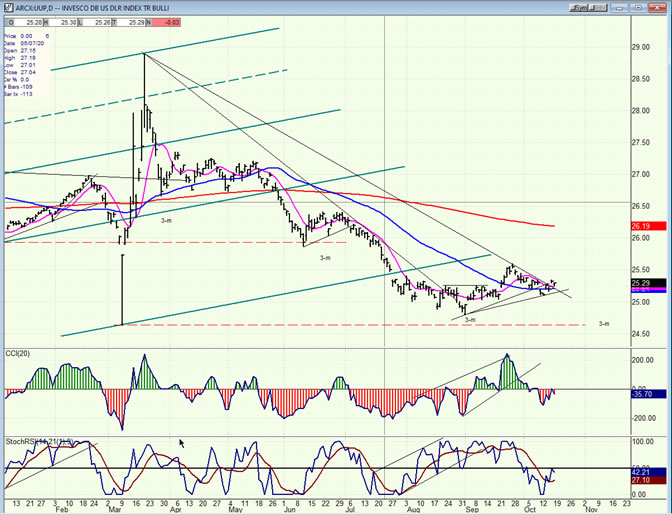
- UUP (dollar ETF) ($USD chart not available from this data provider)
- UUP managed to move back above its blue 50-dma as well as its 9-dma. This also puts it outside of its new downtrend line, suggesting that an extension of its minor uptrend is still possible until the next 3-mo cycle pulls it back down.
-
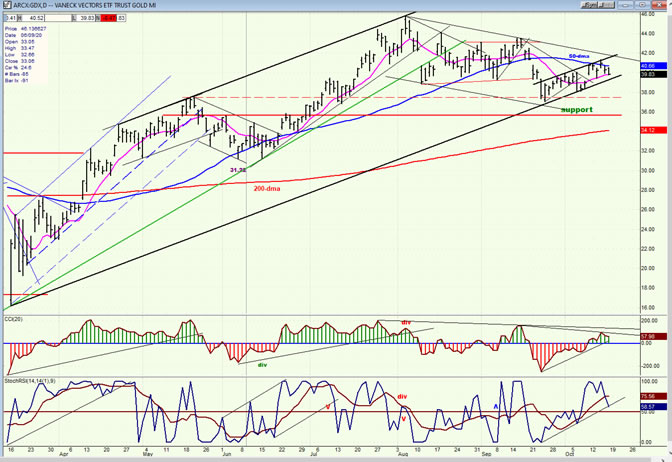
- GDX (gold miners)
- GDX rebounded from a short-term decline after it found support on its lower channel line. However, the crawling pattern on the latter is not an indication of strength, especially since it turned down at its 50-dma. Best guestimate is that the channel line will be broken and that GDX will at least retest its last minor low and perhaps move slightly below it.
-
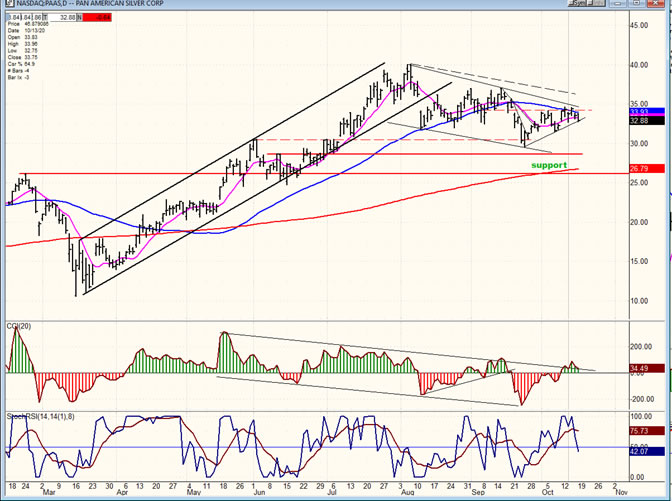
- PAAS (Pan American Silver Corp)
- Analyzing UUP and GDX side-by-side can be valuable since the two often move in opposite directions. This is also true of comparing PAAS to GDX since the two trends have a strong positive correlation. As GDX, PAAS is also vulnerable to a subsequent near-term low before it can re-establish its uptrend.
-
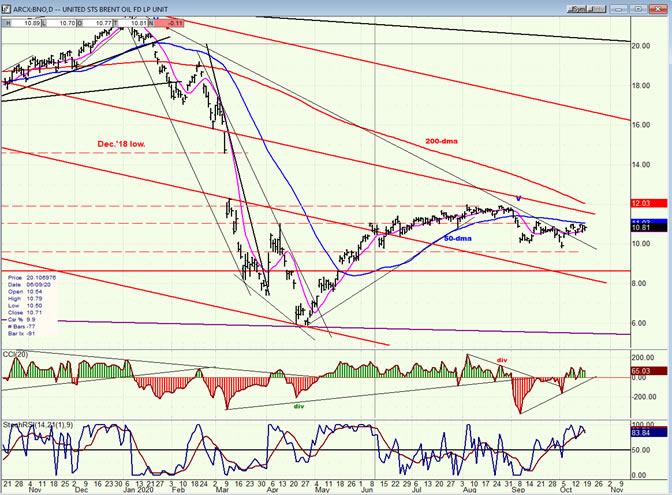
- BNO (U.S. Brent Oil fund)
- BNO has bounced after making a new minor low, but it has not been able to move above its 50-dma and looks ready to move lower again. This index is essentially caught in a long-term downtrend from which it has not successfully been able to reverse and is not likely to do so until it builds a base from which it can spawn another rally. This could take quite a while!
-
- SUMMARY
Andre
NOTE: A new website is in the process of being built!
FREE TRIAL SUBSCRIPTON
For a FREE 4-week trial, send an email to anvi1962@cableone.net, or go to www.marketurningpoints.com and click on "subscribe". There, you will also find subscription options, payment plans, weekly newsletters, and general information. By clicking on "Free Newsletter" you can get a preview of the latest newsletter which is normally posted on Sunday afternoon (unless it happens to be a 3-day weekend, in which case it could be posted on Monday).
Disclaimer - The above comments about the financial markets are based purely on what I consider to be sound technical analysis principles uncompromised by fundamental considerations. They represent my own opinion and are not meant to be construed as trading or investment advice, but are offered as an analytical point of view which might be of interest to those who follow stock market cycles and technical analysis.
Andre Gratian Archive |
© 2005-2022 http://www.MarketOracle.co.uk - The Market Oracle is a FREE Daily Financial Markets Analysis & Forecasting online publication.