


Stock Market Short-term Top Expected
Stock-Markets / Stock Markets 2020 Oct 13, 2020 - 01:28 PM GMTBy: Andre_Gratian

Current Position of the Market
SPX Long-term trend: For now, the best guesstimate is that we are still in the bull market which started in 2009. Where we go from here and how far will be gauged after the September-October correction.
SPX Intermediate trend: Intermediate correction nearly over?
Analysis of the short-term trend is done daily with the help of hourly charts. It is an important adjunct to the analysis of daily and weekly charts which discuss longer market trends.
Daily market analysis of the short-term trend is reserved for subscribers. If you would like to sign up for a FREE 4-week trial period of daily comments, please let me know at anvi1962@cableone.net
Short-term Top Expected
Cycles: Looking ahead! 90-yr cycle – last low: 1932. Next low: 2022
7-yr cycle – last low: 2016. Next low: 2023
Nest of short-term cycle lows on about 10/15-20
Market Analysis (Charts courtesy of QCharts
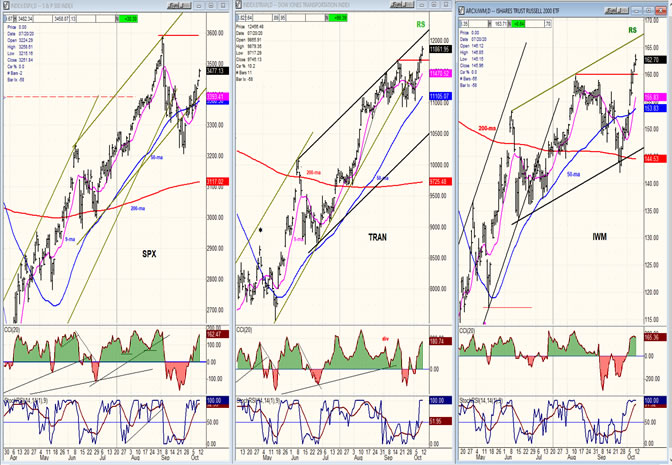
SPX-TRAN- IWM – daily charts
In an unusual display of strength, last week IWM made a new high and surged ahead of SPX to join TRAN in displaying short-term relative strength. With both leading indicators now outperforming SPX short-term, we should expect more market strength in the intermediate term. It should be noted that while TRAN is at an all-time high, suggesting that SPX is most likely on its way to make another one itself, IWM is not; but for now, its new recovery high has a positive connotation for the market.
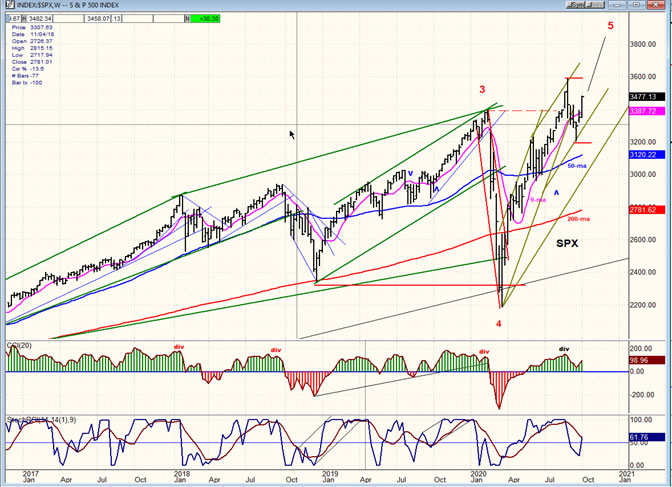
SPX weekly chart
The weekly chart is not yet showing any sign of weakness. The correction which occurred after SPX made a new all-time high appears to have been limited to the top of the first support level, and the strong rally which has ensued suggests that the index remains in a long-term uptrend and is probably on its way to making a new all-time high after a short-term correction to satisfy minor cycles.
From a structural stand point, the likely scenario is that after completing wave 4 at the 2192, wave 5 has already made a new all-time high and should continue to push higher for a few more weeks or months before it ends and brings the bull market which started in 2009 to a close.
How much time is left in wave 5 can best be appraised by looking at the oscillators at the bottom of the chart which will first need to show negative divergence, and then give a sell signal.
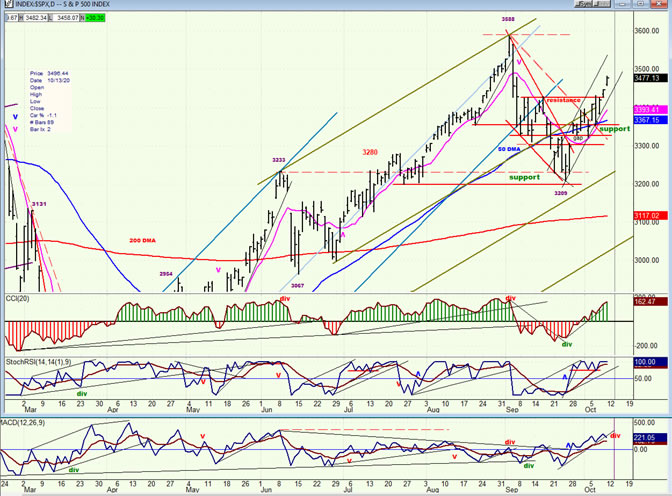
SPX daily chart
When SPX started to correct from 3588 it quickly dropped to ~3200 where it found support and rebounded. The rebound first rose above a downtrend line, then outside of the down channel, and finally last week overcame resistance by moving above 3430. Until all this was accomplished, there was still a possibility that the correction could retrace a normal .382 of the previous up-trend down to ~3050. It is now safe to say that this is no longer likely.
However, what is likely is that we have met the projection from the base which was established at about 3200. As stated above, a nest of short-term cycles is due to bottom over the next week to ten days which could bring about a short-term top as early as Monday. After that short-term correction, we can resume the uptrend and perhaps even make a new all-time high before the next short-term correction.
Earlier, I stated that we are probably in wave 5 of the bull market. That in itself imposes a time limit on what is left of the long-term uptrend, and the long-term cycles due to make their lows in 2022-2023 also tell us that we should soon be looking for signs that a major reversal is about to take place. Before March, it was estimated that the bull market could be sustained until SPX could reach about 4000. The base which was established at the 2192 low foresees the same possibility. We will see if that is what the index tells us it wants to do as we move forward.
The first sign of negative divergence has appeared in the A-D oscillator. If we have arrived at the suggested short-term top, this should be confirmed by the momentum oscillators, as well as the market itself over the next couple of days.
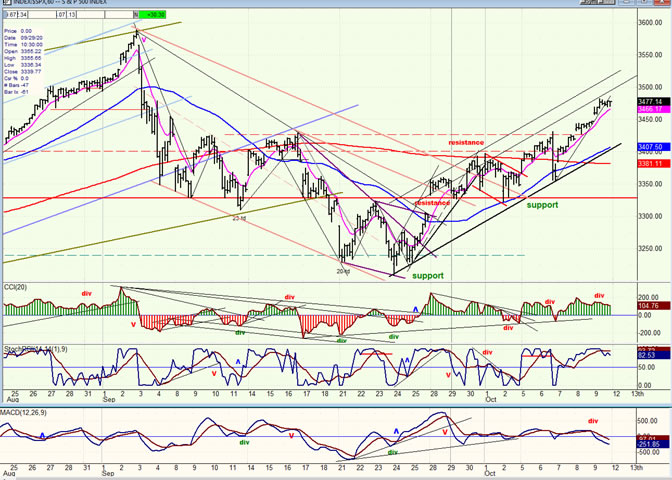
SPX hourly chart
By the end of the day on Friday, negative divergence was showing in all three hourly oscillators. This, plus having reached the potential P&F projection of ~3480-90 should be enough to warn that a short-term reversal is imminent. I also mentioned that minor cycles are due to make their lows over the next week to ten days. It would therefore not be too much of a stretch to expect a minor correction to start from the vicinity of Friday’s high.
Some congestion should develop over the next day or so which would help us determine how much of a correction it will be, but a decline of about a hundred points down to the 200-dma (3381) would be about right. This would also correspond to the upper levels of the resistance band which was just overcome by the index and which should now become support.
We will see where we are by next weekend.
-
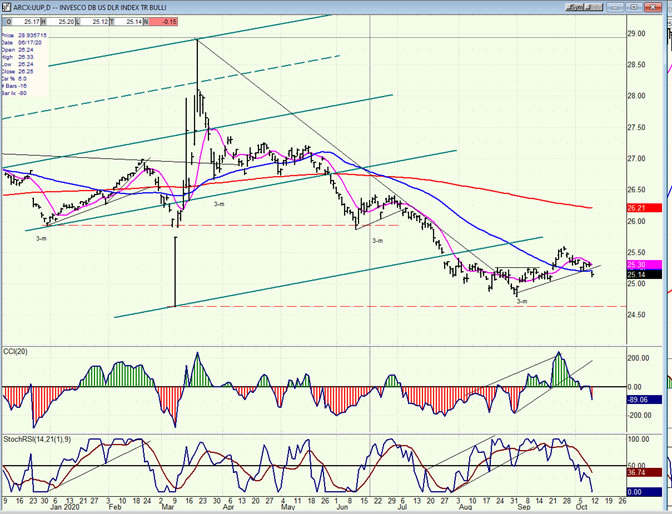
- UUP (dollar ETF) ($USD chart not available from this data provider)
- UUP was not able to accomplish more than a mild recovery after making its 3-mo low. After attempting to hold above its 50-dma, Friday saw a break below it. This would not be important if the oscillators had not confirmed the break, but it now appears that whatever strength UUP derived from its 3-mo low, it was only temporary. Nevertheless, if UUP can manage to get back above the MA right away, it may be able to extend its uptrend a bit longer.
-
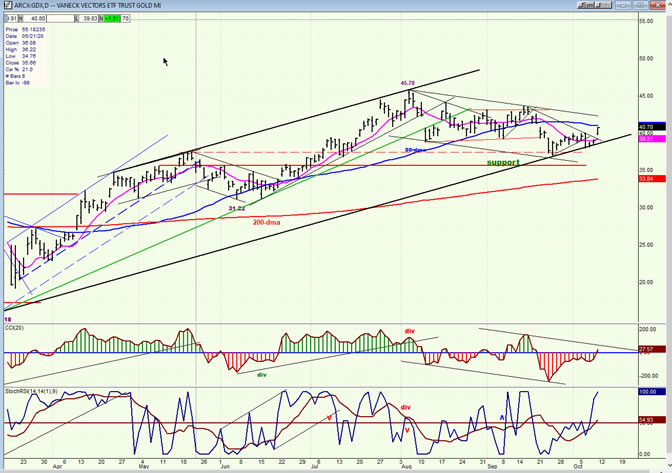
- GDX (gold miners)
- After holding and then retesting the channel bottom, GDX pulled away from it on Friday. This could be a sign that the index is ready to resume its long-term uptrend, but more consolidation is likely, even if it turns out to be at a slightly higher level.
-
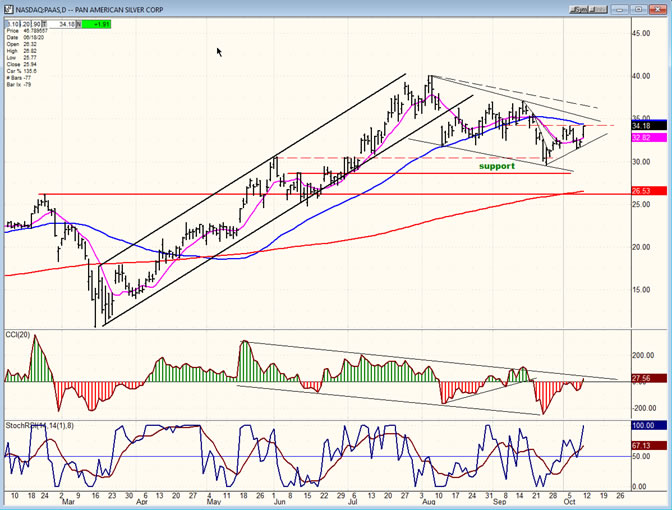
- PAAS (Pan American Silver Corp)
- It would have been unusual for GDX to show some strength without PAAS tagging along. Both indexes must prove that this is the beginning of an important move. For some time, both have gone along with the market trend, although not necessarily matching its strength or weakness. If, as I believe, SPX is due for a correction of a week or more, it is likely that the metals will follow. This would give them a chance to make a nice short-term double bottom pattern after which they would be ready for a more sustained move on the upside.
-
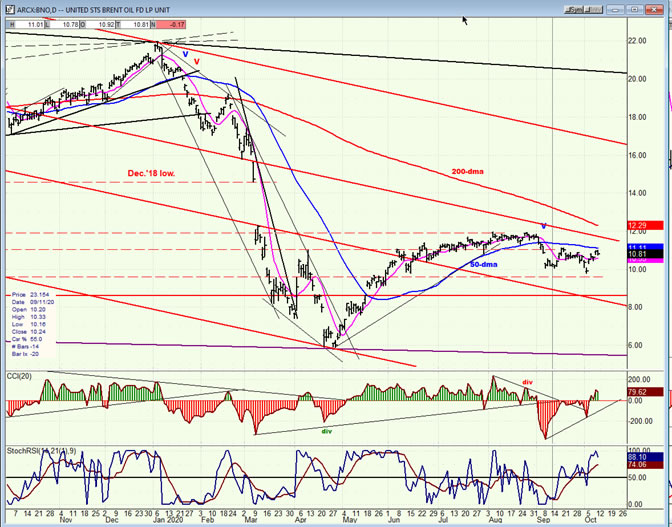
- BNO (U.S. Brent Oil fund)
BNO touched 10 and bounced back up to its 50-dma on low volume. As long as BNO remains below its 50-dma it remains in a correction mode.
-
- Summary
By moving above 3430 -- thereby overcoming an important resistance band which started at 3330 -- SPX has shown that it is no longer susceptible to a .382 retracement of the move from 2192. It is, however, susceptible to a minor correction of a week to ten days.
Andre
NOTE: A new website is in the process of being built!
FREE TRIAL SUBSCRIPTON
For a FREE 4-week trial, send an email to anvi1962@cableone.net, or go to www.marketurningpoints.com and click on "subscribe". There, you will also find subscription options, payment plans, weekly newsletters, and general information. By clicking on "Free Newsletter" you can get a preview of the latest newsletter which is normally posted on Sunday afternoon (unless it happens to be a 3-day weekend, in which case it could be posted on Monday).
Disclaimer - The above comments about the financial markets are based purely on what I consider to be sound technical analysis principles uncompromised by fundamental considerations. They represent my own opinion and are not meant to be construed as trading or investment advice, but are offered as an analytical point of view which might be of interest to those who follow stock market cycles and technical analysis.
Andre Gratian Archive |
© 2005-2022 http://www.MarketOracle.co.uk - The Market Oracle is a FREE Daily Financial Markets Analysis & Forecasting online publication.