


Trading the Silver to Gold Price Ratio
Commodities / Gold & Silver Oct 14, 2008 - 03:32 AM GMTBy: Peter_Degraaf

 Historically (1808 – 2008), the ratio between gold and silver has been 33 ounces of silver equals one ounce of gold. More recently, say 1978 – 2008, the ratio has widened to on average, 60 ounces of silver buys one ounce of gold. At the extremes the ratio fell to 17:1 in 1980 as both metals peaked; and rose to 100:1 in 1991 during the depth of the recession.
During the 1976 – 1980 bull market in precious metals, the ratio fell from 40:1 to 17:1
During the 1990 – 1991 recession the ratio rose from 71:1 to 100:1
The latest bull market in silver began in 2003, and from then until mid 2008, the ratio dropped from 80:1 to 45:1.
A few months ago, as more and more people began to suspect that the world was heading for a recession, the ratio rose again, from 50:1 to the current 80:1
A LESSON FROM HISTORY.
The clear lesson from history is that we can expect silver to drop faster than gold during a recession, and silver will rise faster than gold during a bull market in the metals.
A simple application of this observation is to trade silver for gold in the middle of a recession, when a bull market in gold and silver is about to start, and to trade gold for silver at the top of a bull market in precious metals.
It behooves us to remember that the actual peaks only last for a few seconds. Though the action will show up as a line on a chart henceforth forever, the actual amount of any stock or commodity traded at the precise peak is minimal. Most of the action takes place when traders are convinced that a top (or bottom), is in place.
It is said that technical analysis works best when it is based upon fundamental analysis. The fundamentals for gold are very bullish. Supply is coming from three sources, gold mines, recycling and central banks. The gold mines are supplying less gold every year, as mines become depleted and new mines are not coming on stream fast enough.
Mining experts do not expect any large new gold mines, until the gold price rises above $1,200.00
South Africa 's gold mines, the world's #2 suppliers, are still suffering from power shortages, and mines there are delivering about 10% less gold compared to a year ago.
The world's #1 supplier, China, is reported to be keeping all the gold mined in China within its borders, to balance its reserves, which at last report were less than 3% of its huge ‘paper reserves.'
Supply of scrap gold has been rising, along with the higher price, but that supply is finite.
It will no doubt rise each time there is a sharp rise in the gold price, but eventually it drops off, as people run out of rings, bracelets and gold teeth.
The supply of gold from central banks was predictable at 500 tonnes per year, until the 2007-08 fiscal year, when sales dropped off noticeably.
The suspected reason for this drop is very likely the credit crisis, as central bankers realize they need to hold onto gold to create the illusion that the paper and digital money they have issued is safe, since they have gold with which to back up all that paper. Never mind that gold is no longer used for that purpose.
Demand for gold is very strong, especially at the investment level. Reports of shortages of coins and small bars have come in from all over the globe. Several Mints have stopped taking orders, and other mints are working overtime to fill orders. Dealers are paying a premium over bullion value in order to replace stock they sold earlier.
THE OUTLOOK FOR SILVER.
The picture for silver is even more bullish! Silver has been in deficit for the last 18 years. The dramatic rise in the price of silver that ended in 1980 enticed people all over the world to cash in, by selling old coins, silverware, cutlery as well as silver jewelry purchased over the years from manufacturers in Mexico, Peru and Italy. (As an aside, a large portion of silver jewelry, even though it will be marked .925, is actually silver plated . It pays to buy silver jewelry only after checking it over with a magnet! That goes for chains and bracelets that are for sale in ‘reputable stores' as well! Caveat emptor).
It took the world's economies about 10 years to convert this 1980's excess silver back into useful format, and either use it up, or see it disappear into an investment portfolio, and today it is estimated that the world ‘consumes' 1.5 ounces of silver for every 1 ounce the mines are producing.
The majority of silver that is used in industry, is applied in very small amounts such as cell phones, computers, TV's, refrigerators, medical applications, satellites, weapons systems, electrical wiring applications etc. In the majority of cases this silver is never recovered.
THE MAIN DRIVER.
The main driver for the rise in the silver price between 1976 and 1980, and the concurrent dropping in the ratio, was investment demand. People were concerned about the dramatic rise in price inflation they were experiencing.
Ironically history is repeating again! Not only are we seeing dramatic increases in the price of the foods we eat and the products we use, but this time we have problems in the banking sector as well. Since we know that governments fight problems by throwing money at the problem, we can be sure that inflation is going to be with us for quite a while.
AN ADDED FACTOR.
When we compare the supply vs demand factor for silver, we need to be aware of the fact that since 1980 we have almost 2 billion consumers who were not in the marketplace in 1980. Most of them live in India and China , and large numbers among them are moving up into middle class status. Middle class people all over the world love ‘gadgets'. Gadgets require silver. It just happens that people in those two countries also have an affinity for precious metals.
Thus we have confluence of factors on the demand side of both silver and gold: Investment demand, industrial demand, along with the fear factor, due to the current credit crisis (which will be with us for years to come).
THE BLACK SWAN.
Hiding behind some tall weeds is a black swan. As outlined above, the time to switch from silver to gold is when a bull market in precious metals is about to start (or to resume after a correction). Precious metals have corrected since March of 2008, and may well be ready to resume rising. The black swan is the almost certain fact that a number of bullion banks, aided by central banks have taken on very large ‘naked short positions' in gold, and especially in silver. The fact that we are now witnessing a dual pricing system in gold and especially in silver, (‘paper silver a-la-Comex' versus ‘real silver' which applies to anyone attempting to buy physical silver), is a direct result of this blatant manipulation in the precious metals markets. When this manipulation ends, it will add extra energy to the bull market.
Just ask yourself this simple question: If a billionaire (and there are lots of them out there), wanted to buy 1 billion dollars in gold could he do it?
If the same billionaire wanted to buy 1 billion dollars in physical silver, could he do it?
The answer to both questions is ‘yes', but while buying the silver, he would drive the price up by multiples of the current price. Silver is scarce!
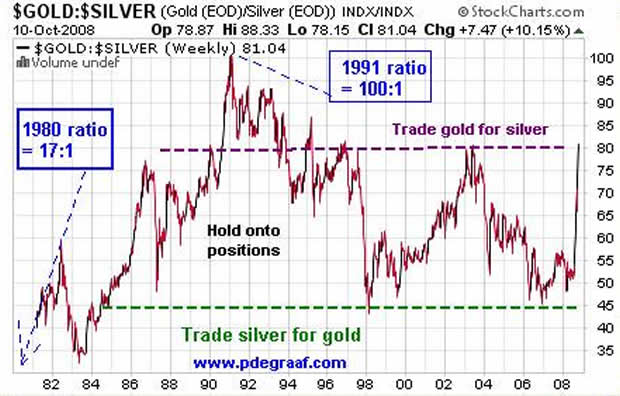
Chart courtesy www.stockcharts.com
Since 1984 a trading range has developed in the ratio. With the ratio near 45 it makes sense to trade silver for gold, until the ratio breaks sharply below 45 and thereby indicates that it is starting a new trend. With the ratio near 80, and even if it rises back up to 100 it makes sense to trade gold for silver.
IN CONCLUSION.
- The bull market in precious metals very likely has not even reached the half-way point in either price or time. (Gold started in 2001 and silver in 2003). “Real interest rates” are currently negative (T-bill minus CPI), and gold always thrives in that kind of environment.
- The credit crisis will be with us for a number of years and governments will continue to ‘print' money to ‘solve' the problem. The US Federal Reserve is currently expanding the Monetary Base in excess of 20%! Money supply is growing on a global basis. The US budget deficit this year will be another record.
- Investment in the metals is just beginning to move from ‘stealth' into main stream. This process takes years, as people are slow to change investing habits.
- The current perception of a recession in the USA , and the depth thereof, may be overblown, thanks to a biased media. (Believe it or not, some people in the media will say whatever they feel led to say, in order to make their favorite party look good, and the party they want out to look bad). In any event, the slowdown we are experiencing in North America may not affect Asia very seriously. China 's #1 customer is not the US , but Japan. As soon as confidence in the world economy returns, we can expect the ratio to drop again.
- The recent rise in the US dollar was caused by at least two factors: First: hedge funds were unwinding positions that were short the dollar and long oil. Oil appears to have bottomed at 80, thus that factor is now ‘in the market'. Second, it was thought that the Euro (which makes up 57.6% of the US dollar index), was going to be even more negatively affected by the credit crisis than the dollar. That condition is now also ‘in the market', and leaves the dollar vulnerable to a sell-off. In the past, weakness in the dollar has translated into strength in metals.
- Silver is now scarcer than gold! This factor alone makes me steer my investment dollars into silver, rather than in gold for the time being. My long-term target for the ratio is 10:1, and I base that on the growing demand for silver as an industrial metal in combination with silver as an investment, while the supply of silver continues to dwindle. When I first became interested in silver in the early 1960's, the US government had a stockpile of 2.5 billion ounces. That silver is gone, used up! Before the ratio drops again, it could rise above 80, and could even reach 100 again as it did in 1991. If that happens, I will become even more convinced that it is time to trade gold for silver.
- As I prepared this article, gold at the Comex was down 17.00, while silver was up .50c; a sign of things to come?
By Peter Degraaf
Peter Degraaf is an on-line stock trader with over 50 years of investing experience. He issues a Weekend Report on the markets to his many subscribers. A sample copy of a recent report is available upon request. Long-term charts are available as a free service at his website www.pdegraaf.com (Due to time constraints and growing administrative costs he no longer offers a free trial service).
DISCLAIMER: Please do your own due diligence. I am NOT responsible for your trading decisions.
Peter Degraaf Archive |
© 2005-2022 http://www.MarketOracle.co.uk - The Market Oracle is a FREE Daily Financial Markets Analysis & Forecasting online publication.