


Gold Price Limited Downside, Big Upside
Commodities / Gold & Silver 2020 Oct 05, 2020 - 02:38 PM GMTBy: Clive_Maund

Technical analyst Clive Maund charts recent movements in the gold market and what they may indicate going forward.
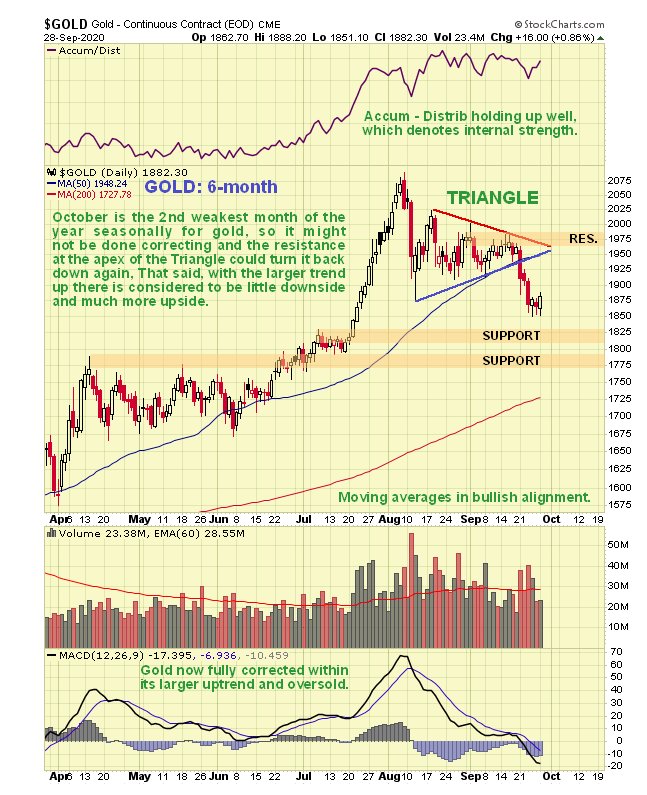
In the last Gold Market update we had thought that it might break out upside from the Triangle that was forming, mainly because of its positive Accumulation line coupled with favorable seasonal factors, but instead, after moving sideways for a while, it broke down, as we can see on its latest 6-month chart below. The good news is that no technical damage was incurred because of this breakdown, as gold is well above important support and well above its rising 200-day moving average. So the fact is that that this drop has actually improved its technical condition by completely unwinding its earlier overbought condition.
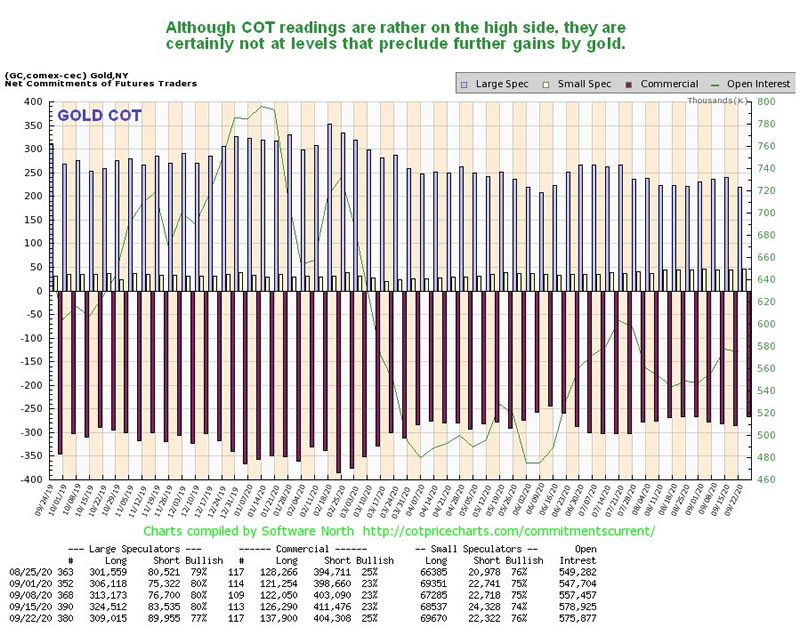
While the latest gold COT chart shows that readings are still somewhat on the high side, they are certainly not at levels that preclude another upleg.
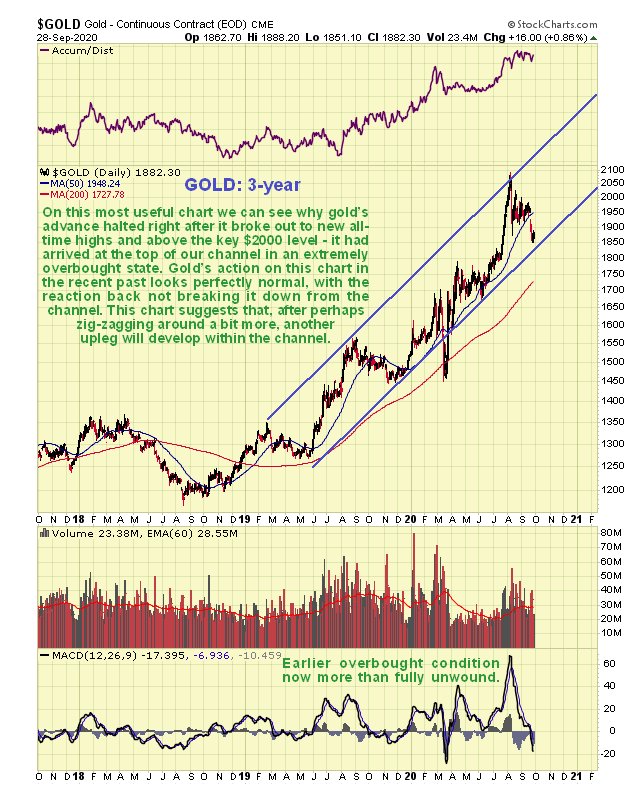
On the 3-year chart we can see why it was probably for the best that gold didn't break out upside from its Triangle, as that would have resulted in the uptrend becoming steeper and probably unsustainably steep. Instead, we can see that it seems to want to remain in the uptrend channel that we earlier delineated. So it is interesting to observe that the break lower over the last week or two did not result in it breaking down from its uptrend channel, instead it has approached its lower boundary which is a good place for it to turn higher again, and that's what seems to be happening.
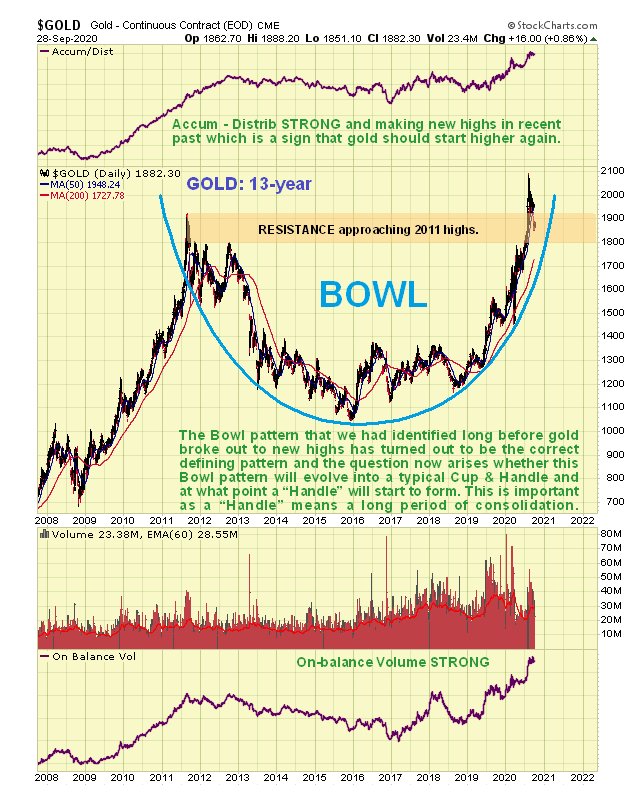
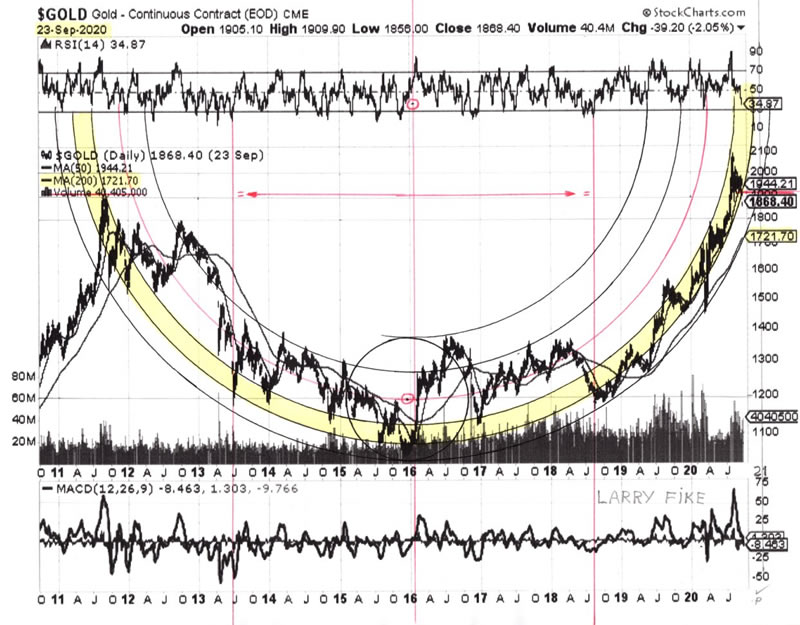
On the latest 13-year chart we can see that gold is being propelled higher rapidly by the now steeply rising right side of its Cup base that has already driven it to new highs, and as long as the Cup boundary is not breached it should continue to ascend swiftly. Given that we are in a rapidly changing economic situation with Fed money creation going exponential as they race to stave off economic implosion, this pattern could drive a spectacular vertical ascent by gold, but at the same time we take note of the fact that, should the price breach the Cup boundary, we could see a lengthy period of consolidation with a Handle forming to complement the Cup, so the pattern ends up as a classic Cup & Handle base.
Larry's latest gold chart suggests it will either slingshot much higher very soon, or break down from the hemispherical Bowl pattern and run off sideways for some time to form a Handle consolidation.
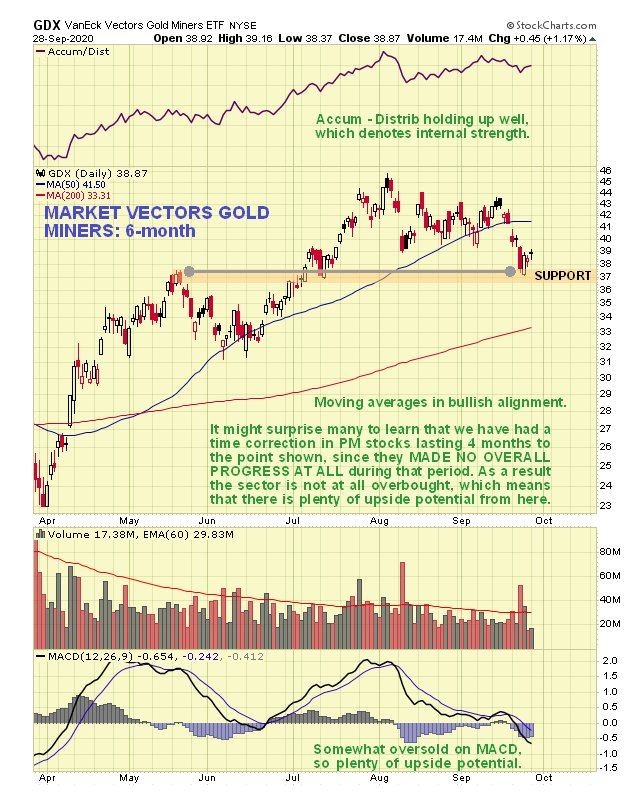
If gold looks set to take off higher again, then what about gold and silver stocks? The latest 6-month chart for GDX shows that they should too, with it looking like it is completing a corrective phase from its early August highs, and the chart looking overall positive with the Accumulation line holding up and moving averages in bullish alignment. On this chart it is interesting to observe that a time correction has been in force across the sector for 4 months now, with GDX having made no net progress from mid-May to its low a few days back. So there is now "plenty of gas in the tank" for a sizable upleg, should it decide it wants to make one.
The latest Gold Miners Bullish % Index shows a considerable improvement in sentiment over the past week – far too many people had been bullish, but this has now moderated substantially, and while there is still room for improvement, this index has certainly moderated sufficiently to permit another sizable upleg to begin.
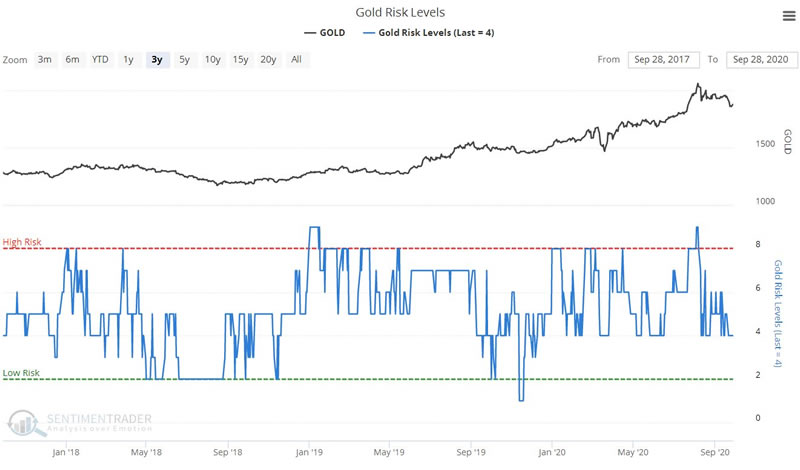
The latest Gold Risk Levels chart shows that risk for longs has moderated greatly since its early August peak.
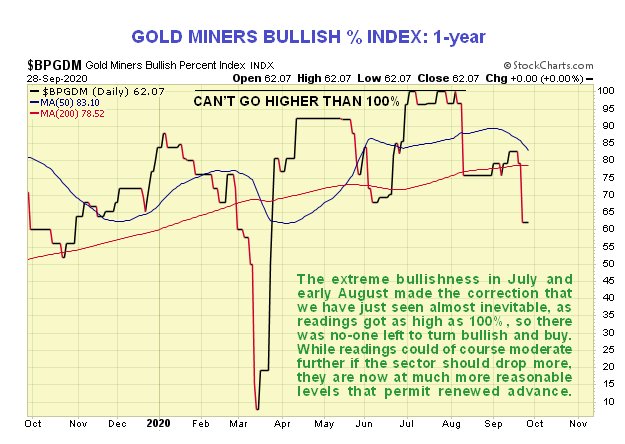
Chart courtesy of sentimentrader.com
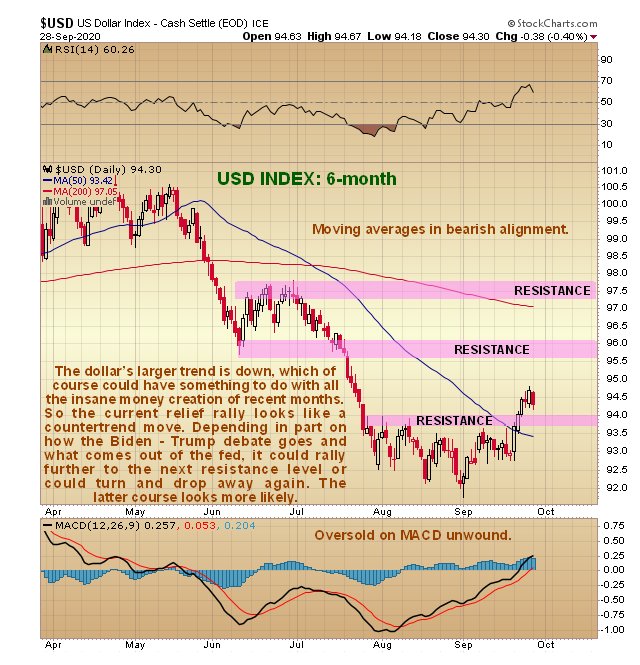
The larger trend of the dollar is down and therefore the modest rally of the past week or so is regarded as a bear market rally, despite it breaking above a line of resistance at 94 on the index, as we can see on its latest 6-month chart below. This "achievement" does open up the possibility of the countertrend rally running to the next significant resistance level in the 95.60 – 96 zone, although it is thought more likely that it will roll over and drop away again.
Clive Maund has been president of www.clivemaund.com, a successful resource sector website, since its inception in 2003. He has 30 years' experience in technical analysis and has worked for banks, commodity brokers and stockbrokers in the City of London. He holds a Diploma in Technical Analysis from the UK Society of Technical Analysts.
Disclosure: 1) Statements and opinions expressed are the opinions of Clive Maund and not of Streetwise Reports or its officers. Clive Maund is wholly responsible for the validity of the statements. Streetwise Reports was not involved in the content preparation. Clive Maund was not paid by Streetwise Reports LLC for this article. Streetwise Reports was not paid by the author to publish or syndicate this article. 2) This article does not constitute investment advice. Each reader is encouraged to consult with his or her individual financial professional and any action a reader takes as a result of information presented here is his or her own responsibility. By opening this page, each reader accepts and agrees to Streetwise Reports' terms of use and full legal disclaimer. This article is not a solicitation for investment. Streetwise Reports does not render general or specific investment advice and the information on Streetwise Reports should not be considered a recommendation to buy or sell any security. Streetwise Reports does not endorse or recommend the business, products, services or securities of any company mentioned on Streetwise Reports. 3) From time to time, Streetwise Reports LLC and its directors, officers, employees or members of their families, as well as persons interviewed for articles and interviews on the site, may have a long or short position in securities mentioned. Directors, officers, employees or members of their immediate families are prohibited from making purchases and/or sales of those securities in the open market or otherwise from the time of the interview or the decision to write an article until three business days after the publication of the interview or article. The foregoing prohibition does not apply to articles that in substance only restate previously published company releases.
Charts provided by the author.
CliveMaund.com Disclosure: The above repr0esents the opinion and analysis of Mr Maund, based on data available to him, at the time of writing. Mr. Maund's opinions are his own, and are not a recommendation or an offer to buy or sell securities. Mr. Maund is an independent analyst who receives no compensation of any kind from any groups, individuals or corporations mentioned in his reports. As trading and investing in any financial markets may involve serious risk of loss, Mr. Maund recommends that you consult with a qualified investment advisor, one licensed by appropriate regulatory agencies in your legal jurisdiction and do your own due diligence and research when making any kind of a transaction with financial ramifications. Although a qualified and experienced stock market analyst, Clive Maund is not a Registered Securities Advisor. Therefore Mr. Maund's opinions on the market and stocks can only be construed as a solicitation to buy and sell securities when they are subject to the prior approval and endorsement of a Registered Securities Advisor operating in accordance with the appropriate regulations in your area of jurisdiction.
© 2005-2022 http://www.MarketOracle.co.uk - The Market Oracle is a FREE Daily Financial Markets Analysis & Forecasting online publication.