Gold, Silver & HUI Stocks Big Pictures
Commodities / Gold & Silver 2020 Sep 28, 2020 - 11:02 AM GMTBy: Gary_Tanashian
Gold, silver and the HUI Gold Bugs index are viewed here by their big picture monthly charts. In NFTRH we use mainly daily and weekly charts of these along with individual miners to better gauge the shorter-term pictures, which will advise on the end of the correction better than these more cumbersome monthlies that are great for keeping perspective amid the shorter-term noise.
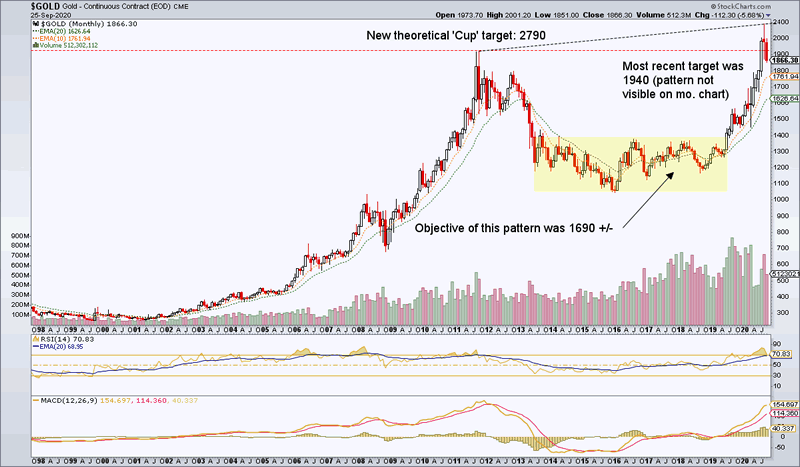
Our target for gold was 1940, established in April off a daily chart pattern. That target was blown through and as the monthly chart shows, a big picture Cup was formed as it made a higher high right around the time that the Buffett hype signaled the oncoming correction as we noted on August 17th:
[edit] For the purposes of this article “correction” means consolidation, now turned correction. I for one did not predict a hard correction in August.
“We have a new upside target on gold (w/ the long-standing 1940 in the books) and it’s way up there. But gold would logically need to do so some more grinding to make it happen, per work we’re doing in NFTRH on a lovely monthly chart pattern.”
Here is the monthly chart pattern I was writing about back in August. Don’t sweat the failed breakout. Gold has put its flag in the surface of the moon and after the healthy grind downward (otherwise known as the making of the Cup’s handle) the Cup should play out.
The question is time. Gold has been in correction [consolidation] since early-mid August but the monthly chart handle can drag on another month or more. But it is bullish and should bring opportunity for those who anticipated a correction. We manage the correction each week in NFTRH and in interim updates at nftrh.com.

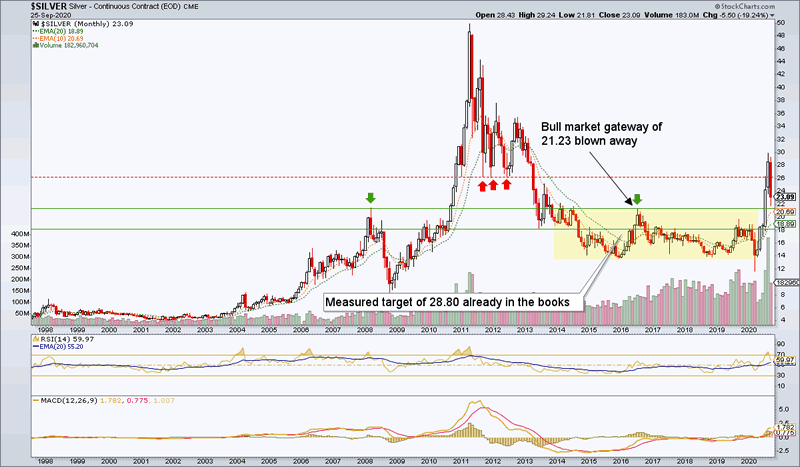
Silver, oh boy… silver. When gold’s nutty little bro made the crash breakdown below 14 I suspected a false breakdown, and that is what it turned out to be. But the resulting rally was an impulsive jail break that tore through our ‘reasonable’ target of 21.23, smashed through our ultimate target of 26-27.50, sucked ’em all in and then well, silver did what silver does; only it did it in the most dynamic fashion since the 2011 bubble blow off. But I believe this was a launch, not a blow off.
Now the drop to test key support at 21.23, the doorway to its new cyclical bull market that it may have, but likely did not, play out in one big gulp. If by our other work we confirm an inflationary 2021 I would not discount new all-time highs in silver. But first things first, gold bugs are getting bled out and silver bugs are getting decimated. Perfect. Opportunity awaits (if inflation carries the day, which our current work on the Gold/Silver ratio, among other indicators, will help define).

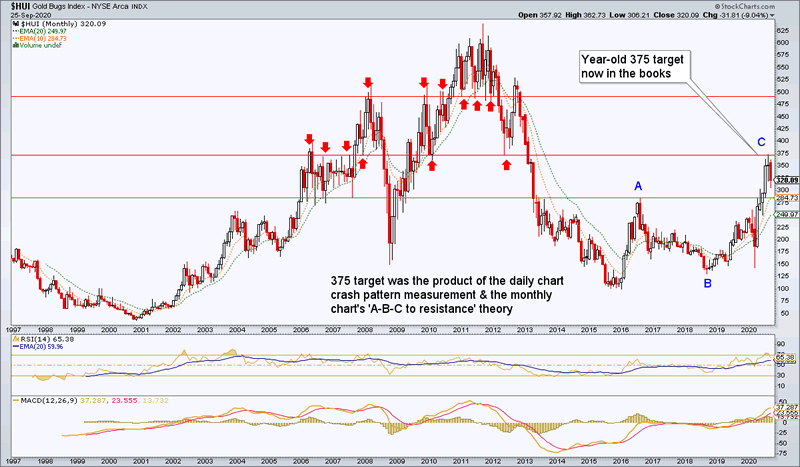
HUI dutifully drove almost exactly to our long-standing target of 375, which has notable resistance dating from 2005 to 2012. There is more strong resistance at 500, which is the next target. But first there is a correction from this logical area to deal with. Huey always was going to at least stop for a breather here.
The A-B-C was anticipated back in 2019 as an ending move to a bear market rally at worst, and not an A-B-C correction at all, but the first 3 waves of a new bull market at best. Considering the still-constructive macro and sector fundamentals currently in play NFTRH analysis now favors a new bull market. It’s already been a cyclical bull market from 2018 [correction: 2016], but we’re talking about the real deal, possibly targeting new all-time highs. Again, the shorter-term charts and especially our sector internals indicators (beyond the scope of this article) will guide.
Here you see one logical support point at the ‘A’ high around 285 (a daily chart would advise that the 200 day average is at 270).

If/as the macro continues to display the proper signals, this will be a special sector. That is why disappointed inflation-bugs are being taken out to the woodshed now as inflation signals wane. The best signals would not include inflation, at least not economically cyclical inflation. The gold sector can bull with a cyclical inflationary backdrop but so would many other areas. It’s just that the miners would not be special. They could bull headlong into a future crash, similar to Q4 2008.
Bottom Line
- Gold is good and targeting much higher levels, but the Handle making is actually a correction to clear the riff raff from the investor base before that rally.
- Silver was impulsive to the upside. It blew out our target and is now back below it. The move appears to have been a launch, however. Bugs getting cleaned out is always a good thing. An inflationary 2021 would help here. Watch silver in relation to gold for indications on that.
- HUI stopped where it was always going to stop, at 375. Now, if the macro goes inflationary HUI can rise significantly (ref. the cycle from 2003 to 2008) and then one day get decimated. If the inflation fails, the gold sector will get sold by inflationists stampeding out as its fundamentals improve by leaps and bounds. That’s a real opportunity and a real bull market.
- As you can see, the precious metals are intimately tied to the macro picture, more so than many other markets. As the Fed and other central banks attempt to inflate to beat the band gold, silver and the miners are front and center.
For “best of breed” top down analysis of all major markets, subscribe to NFTRH Premium, which includes an in-depth weekly market report, detailed interim market updates and NFTRH+ dynamic updates and chart/trade setup ideas. You can also keep up to date with actionable public content at NFTRH.com by using the email form on the right sidebar. Follow via Twitter ;@NFTRHgt.
By Gary Tanashian
© 2020 Copyright Gary Tanashian - All Rights Reserved
Disclaimer: The above is a matter of opinion provided for general information purposes only and is not intended as investment advice. Information and analysis above are derived from sources and utilising methods believed to be reliable, but we cannot accept responsibility for any losses you may incur as a result of this analysis. Individuals should consult with their personal financial advisors.
Gary Tanashian Archive |
© 2005-2022 http://www.MarketOracle.co.uk - The Market Oracle is a FREE Daily Financial Markets Analysis & Forecasting online publication.


