


Gold Price Setting Up Just Like Before COVID-19 Breakdown – Get Ready!
Commodities / Gold & Silver 2020 Sep 27, 2020 - 11:38 AM GMTBy: Chris_Vermeulen

RESEARCH HIGHLIGHTS:
- Gold rebounded quickly and broke to higher prices after the COVID deep selling.
- Our Fibonacci support levels for Gold are resting near $1,885, $1,815 & $1,790.
- More downside pressure on price is possible, but if support is maintained at $1,885 then we could see a big upside recovery trend take Gold to $2,250.
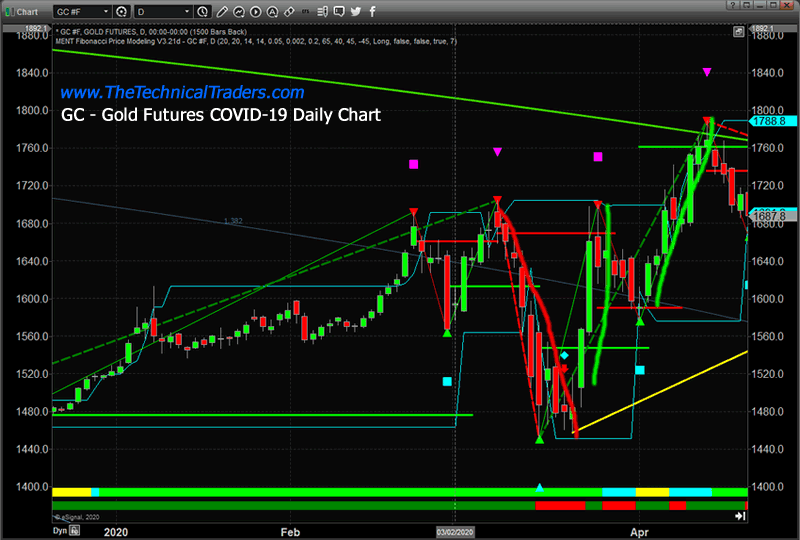
Just before the COVID-19 collapse in the markets hit near February 25, 2020, Gold started a double-dip move after reaching $1,692 on February 24. First, Gold dipped from $1,692 to $1,564, then recovered to new highs ($1,704.50) on March 10, 2020. Then, as the deeper COVID-19 selling continued, Gold prices dipped again – this time targeting a low level of $1,450.90.
What we found interesting is how quickly Gold prices recovered and broke to even higher price levels after this deep selling. Our belief is that when a crisis event first hits, which we sometimes call the “shock-wave”, all assets take a beating – including Gold and Silver. This is the event where traders and investors pull everything to CASH (closing positions). Then, as the shock-wave ends, traders re-evaluate the price levels of assets to determine how they want to deploy their capital.
GOLD BASING NEAR $1885 FOR A BIG RALLY
Our belief that this DIP or double-dip pattern in Gold because of crisis events presents a very solid opportunity for skilled traders to add-to existing positions or strategically target shorter-term upside price swings in precious metals.
This Daily Gold chart below highlights the first dip and the second dip in Gold prices as the COVID-19 price collapse took place. Notice how Gold rotated lower, then recovered to new highs, then dipped even lower in early March 2020. This last dip in price levels was the very deep selling before the March 21 bottom setup (US Fed induced).
Now, take a look at the current Gold Futures Daily chart. Notice the big price correction that started on August 7, 2020 – setting up the FLAG/Pennant formation in Gold. Interestingly enough, this top in Gold also aligns with a moderately deep price correction in the NASDAQ – before continuing to rally even higher. Silver also setup a price peak on August 7, 2020. Now, as the Banking illegalities report has been released, the markets again fell into a shock-wave of selling on Monday, August 21. This time Gold fell just over 3% throughout the day before starting to recover near the end of the day.
Before you continue, be sure to opt-in to our free-market trend signalsnow so you don’t miss our next special report!
Currently, our Fibonacci support levels are resting near $1,885, $1,815 & $1,790 as you can see from the Gold Daily chart below. We believe more downside price pressure may continue in Gold and Silver over the next few days before a strong upside price move begins to take place. The recent low price level in Gold, near $1,885, aligns perfectly with our Fibonacci projected price target (Support) level. If Gold has already found support near this price level, then we may already be hammering out a bottom in Gold setting up a big upside recovery trend.
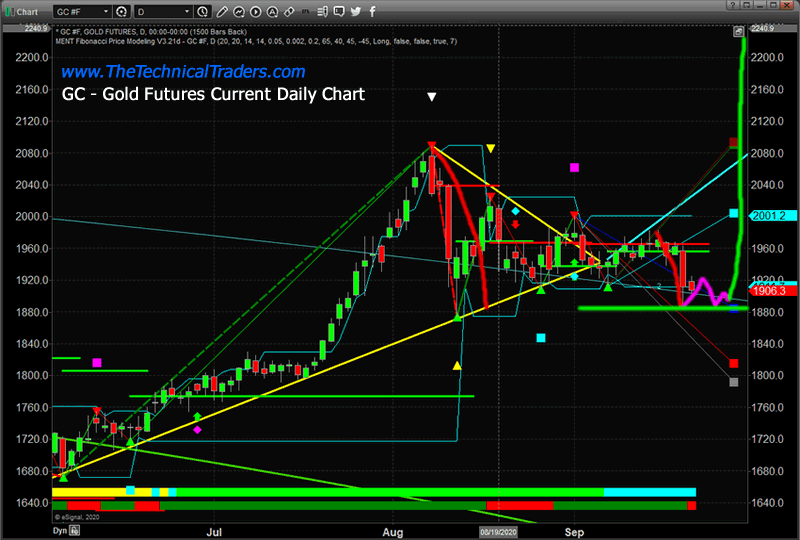
The question for gold traders right now is “does the $1,885 level hold as support or will gold break lower trying to fund support?”. My researchers and I believe the current bottom in Gold is set up and the $1,885 price will hold as support. We also believe the next move higher will prompt a rally targeting levels near $2,250.
Watch for the momentum base to continue to form near $1,885 before the breakout rally trend in Gold starts. Once it breaks the $2,035 level, it should start to rally upward very quickly. If the price of Gold breaks down below $1,885 then we may experience a continuing bottom to the next support level of $1,815.
As a technical analyst and trader since 1997, I have been through a few bull/bear market cycles in stocks and commodities. I believe I have a good pulse on the market and timing key turning points for investing and short-term swing traders.
If you want to survive the trading over a long period of time, then you learn fairly quickly how important it is to protect against risk and to properly size your trades. Subscribers of my Active ETF Swing Trading Newsletter can ride my coattails as I navigate these financial markets and build wealth. My research and trading team are here to help you find better trades and navigate these incredibly crazy market trends.
While most of us have active trading accounts, our long-term investment and retirement accounts are equally at risk. We can also help you preserve and even grow your long term capital when things get ugly (likely now) with our Passive Long-Term ETF Investing Signals. Don’t wait until it is too late – subscribe today!
Chris Vermeulen
www.TheTechnicalTraders.com
Chris Vermeulen has been involved in the markets since 1997 and is the founder of Technical Traders Ltd. He is an internationally recognized technical analyst, trader, and is the author of the book: 7 Steps to Win With Logic
Through years of research, trading and helping individual traders around the world. He learned that many traders have great trading ideas, but they lack one thing, they struggle to execute trades in a systematic way for consistent results. Chris helps educate traders with a three-hour video course that can change your trading results for the better.
His mission is to help his clients boost their trading performance while reducing market exposure and portfolio volatility.
He is a regular speaker on HoweStreet.com, and the FinancialSurvivorNetwork radio shows. Chris was also featured on the cover of AmalgaTrader Magazine, and contributes articles to several leading financial hubs like MarketOracle.co.uk
Disclaimer: Nothing in this report should be construed as a solicitation to buy or sell any securities mentioned. Technical Traders Ltd., its owners and the author of this report are not registered broker-dealers or financial advisors. Before investing in any securities, you should consult with your financial advisor and a registered broker-dealer. Never make an investment based solely on what you read in an online or printed report, including this report, especially if the investment involves a small, thinly-traded company that isn’t well known. Technical Traders Ltd. and the author of this report has been paid by Cardiff Energy Corp. In addition, the author owns shares of Cardiff Energy Corp. and would also benefit from volume and price appreciation of its stock. The information provided here within should not be construed as a financial analysis but rather as an advertisement. The author’s views and opinions regarding the companies featured in reports are his own views and are based on information that he has researched independently and has received, which the author assumes to be reliable. Technical Traders Ltd. and the author of this report do not guarantee the accuracy, completeness, or usefulness of any content of this report, nor its fitness for any particular purpose. Lastly, the author does not guarantee that any of the companies mentioned in the reports will perform as expected, and any comparisons made to other companies may not be valid or come into effect.
Chris Vermeulen Archive |
© 2005-2022 http://www.MarketOracle.co.uk - The Market Oracle is a FREE Daily Financial Markets Analysis & Forecasting online publication.