


Peak Financialism And Post-Capitalist Economics
Economics / Economic Theory Sep 17, 2020 - 02:38 PM GMTBy: Steven_Vincent

The protracted malaise of the 1970s, with high price inflation and GDP recession, signaled the advent of Peak Industrial Capitalism.
The maturation of the industrial sector of the economy and the onset of demographic growth challenges required the offsetting growth of the financial sector.
The standard of living has declined under Financialism, but the technology revolution has offset some of the negative associated trends.
Financialization has increasingly skimmed Economic Value out of the economic system into the pockets of a smaller and smaller group of elites as larger and larger percentages of the population have become more and more dependent on government programs.
What comes after Peak Financialization? Where do we go from here? As I have said in previous segments in this series, an Information-Based Economic System, Technocracy, Structural Unemployment and Universal Basic Income are some of the likely outcomes we can expect.
This article is part of an ongoing related series that explores an ongoing long-term secular systemic shift in markets, economics, politics and society. Readers might also like to read:
- Information Is The New Capital
- Understanding The Apparent Mismatch Between Current Economic Conditions and the Financial System
- Debt Financialization, Gross Domestic Product And The Systemic Paradigm Shift
The protracted malaise of the 1970s, with high price inflation and GDP recession, signaled the advent of Peak Industrial Capitalism. The creation of Economic Value from the transformational processes of industrial production (manufacturing, mining, utilities) began to reach its limits of expansion and growth.
Growth was capped by negative demographic trends including rapidly falling annual births and an aging population.
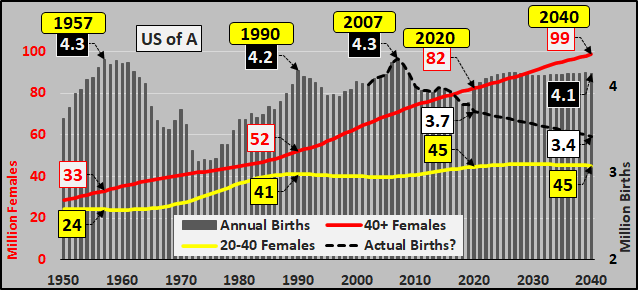
Source: Economica, Chris Hamilton
Growth was also capped by the maturation of the industrial economy in the U.S. and throughout the developed world.
One of the best ways to see the secular trend of declining industrial value generation is through Capacity Utilization.
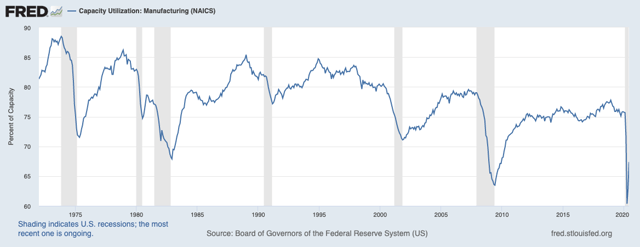
Capacity Utilization has seen lower highs and lower lows continuously since peaking in the early 1970s. In general, if capacity can generate Value, it would be used to its maximum.
Industry as a whole has not significantly increased its percentage contribution to GDP since the late 1960s:
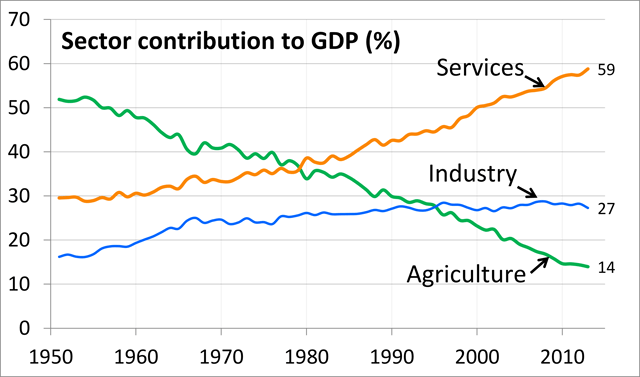
This tends to strongly verify that the sector was mature as of the 1970s.
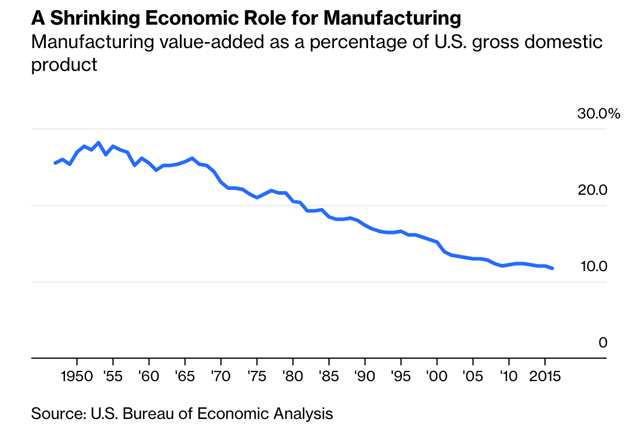
This chart shows that the manufacturing sector of industrial production has been in secular decline relative to GDP for many decades. Meanwhile, Services have continually increased as a percent of GDP. Services do generate Economic Value, but in most cases do so at a less qualitative level than industrial processes. So progressively, lower quality sources of Value generation replaced higher quality sources over time, and this trend accelerated around 1980.
In order for the maturation of the industrial sector of the economy and the onset of demographic growth challenges to be offset, it was necessary for the financial sector to expand its role.
Up until the 1980s, the financial sector had been considered an economic cost. It was regarded as non-productive and was not included in GDP and other economic statistics. Around that time, this began to change, and the role of finance was recast as productive.
Financial entities take the Economic Value generated through transformative processes and amplify (leverage) and distribute (circulate) them while skimming Value out of the system in the form of fees and interest. Since going off the gold standard, the debt explosion and financial "assetization" of everything has had the effect of stimulating the blood flow in the circulatory system of the economy while the rate of growth of Value (the blood) has stagnated and declined.
The Financial Industry share of GDP exploded after 1980. Note this chart is dated 2010 and is likely higher now.
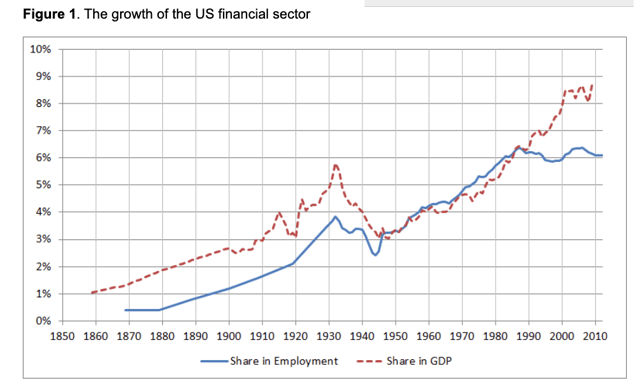
Source: Kirill Shakhnov, VoxEW.org
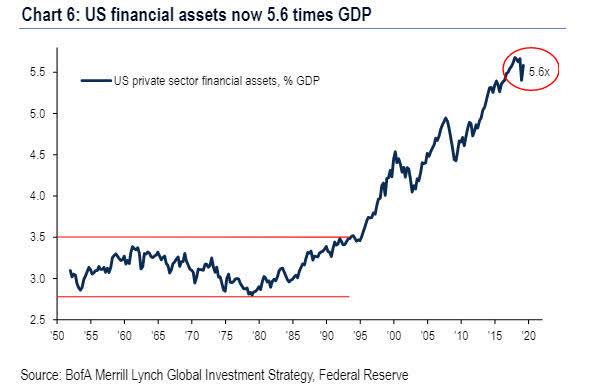
The net worth of US financial assets is now 5.6x the size of GDP:
The Positive Effects of Financialization
While the net economic effect of Financialization have been negative and parasitic, it was a necessary antidote to the maturation and limitations of growth in the productive, Value-generating areas of the economy.
On the positive side of the ledger, Financialist debt monetarism made it possible for western capitalism to outlast the challenges from Marxist states. In a sense, better alive and treading water than Red.
The onset of Financialism also made possible the rapid development and adoption of technology beginning with the boom of the 1980s through to the present. Without the amplified, available and decreasingly costly circulation of Capital to fledgling technology companies, the sector would most likely have taken many more years, even decades, to develop.
While overall it certainly can and should be argued that the standard of living has declined under Financialism, the technologization of society has offset some of the negative trends to some degree. The ubiquitous and low-cost availability of consumer technology does improve the quality of life for millions.
The Negative Effects of Financialization
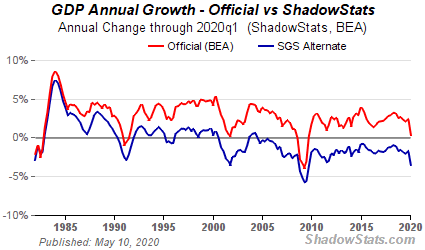
Whether we use the official Bureau of Economic Analysis data or the ShadowStats alternative data, annual growth of GDP has been in a secular decline since 1985:
The next chart (which ends in 2012) shows that in the early stages of Financialization through 1993, median household income fell relative to per capita GDP, and then, in the middle stage, from 1994 to 2000, it rose together with GDP per capita. Since 2000, median household income relative to per capita GDP has fallen below the 1989 level.
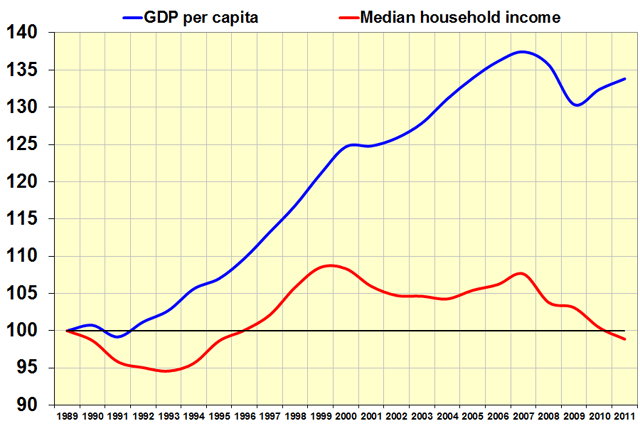
Source: Wikipedia
The above can be considered a picture of declining standard of living. Although gross throughput per capita increased rapidly into 2007, the median household stopped benefiting from the increase in 2000. Effectively we have had two decades of declining standard of living.
The next chart tracks hourly earnings. Nominally they have risen, but adjusted for CPI they peaked in the early 1970s, and when adjusted for real inflation (green), hourly earnings have been declining rapidly since then.
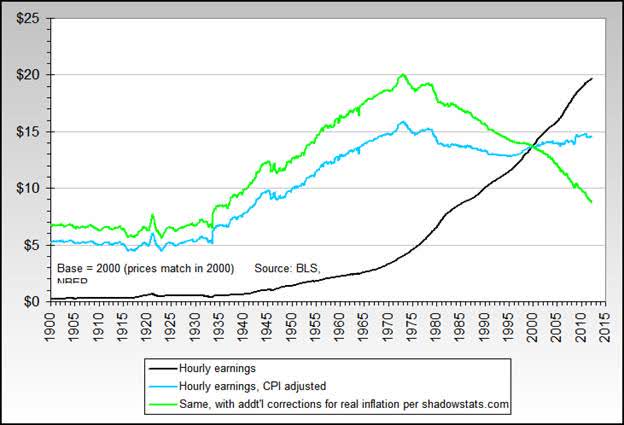
Source: NowAndFutures.com
According to the ShadowStats methodology of tracking, the real long-term unemployment rate bottomed around 2000 and has been rising ever since.
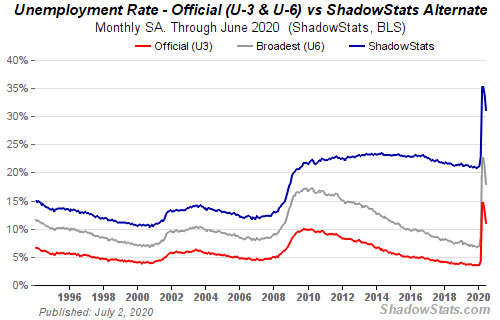
This indicates that structural unemployment (including underemployed and discouraged workers) has seen a secular growth trend hidden by government statistics.
The Labor Force Participation Rate has been in secular decline since 2000 and during the current crisis has plunged to levels seen in the early 1970s, back when most women did not participate in the employed labor force.
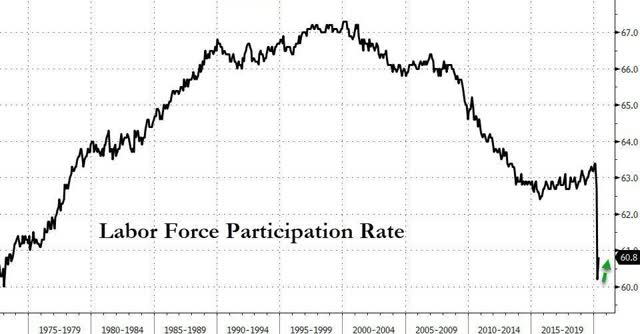
Source: Zero Hedge
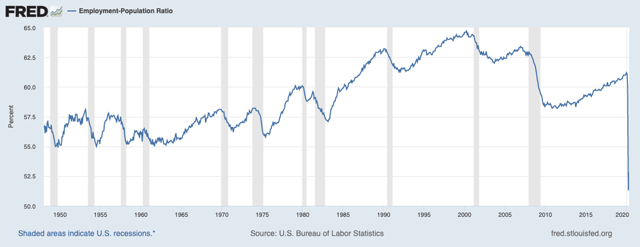
The Employment/Population ratio has been in secular decline since 2000 and has recently plunged to all-time lows.
To summarize the preceding charts in this section, fewer and fewer people have participated in economic growth as growth itself has declined, both in terms of income and employment.
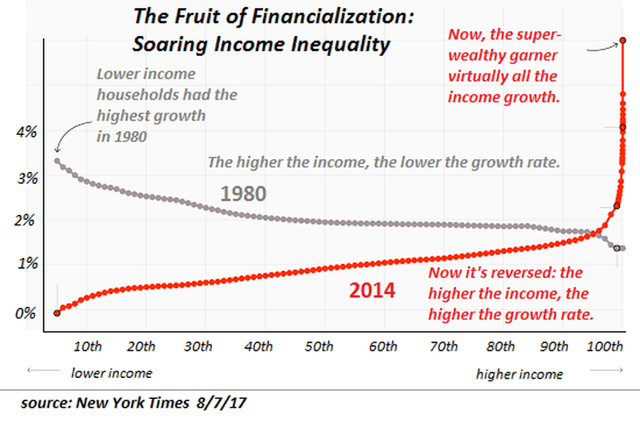
Meanwhile, as income for the population has declined, the income of the wealthy has exploded.
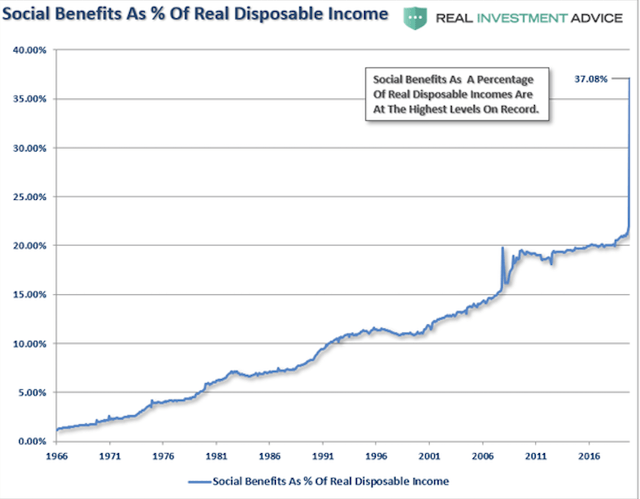
As inequality and insecurity of employment and income has worsened, the population has relied increasingly on social benefits for income:
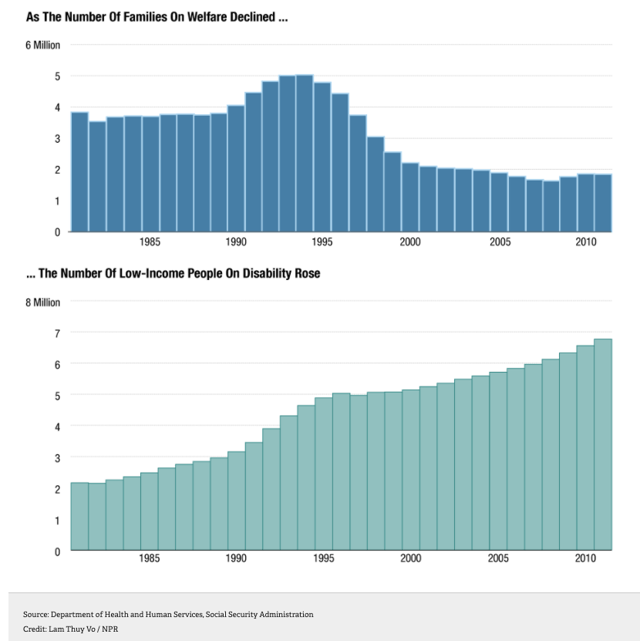
In 1996 Bill Clinton signed Welfare Reform, which did decrease the welfare rolls. This was offset by a concomitant explosion of people filing for Disability:
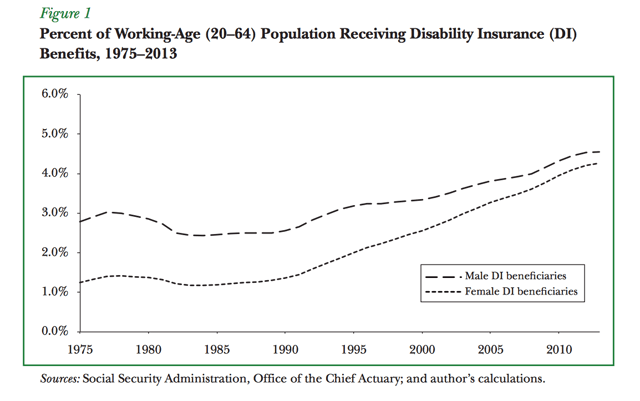
A secular increase in the percentage of working age population that receives Disability payments:
The percentage of people receiving SNAP aka Food Stamps exploded after 2000:
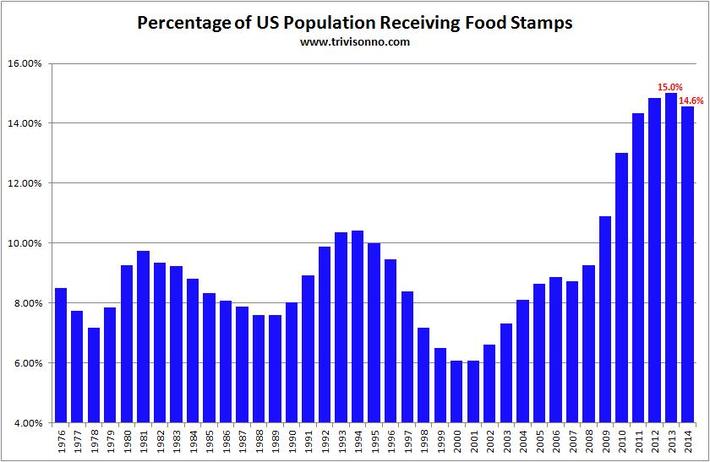
The upshot is that as Financialization has increasingly skimmed economic Value out of the economic system into the pockets of a smaller and smaller group of elites, larger and larger percentages of the population have become more and more dependent on government programs (precursors to Universal Basic Income) for income while the quality of life has declined. This secular, long-term trend is now shifting into a systemic change. The corona-crisis lockdown has functioned as a catalyst for a major leap in that direction. We can and should expect that the informal structural unemployment and Universal Basic Income will be formally institutionalized as foundational elements of the new economy within 10 years.
Financial Engineering
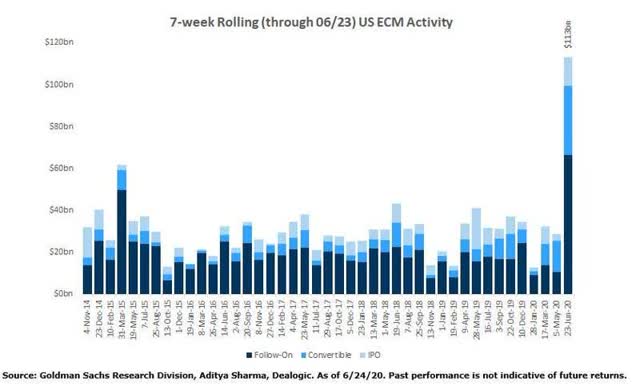
In the May-June 2020 time period, corporate equity issuance exploded to all-time highs as companies took advantage of the rally off the March low to sell stock to investors.
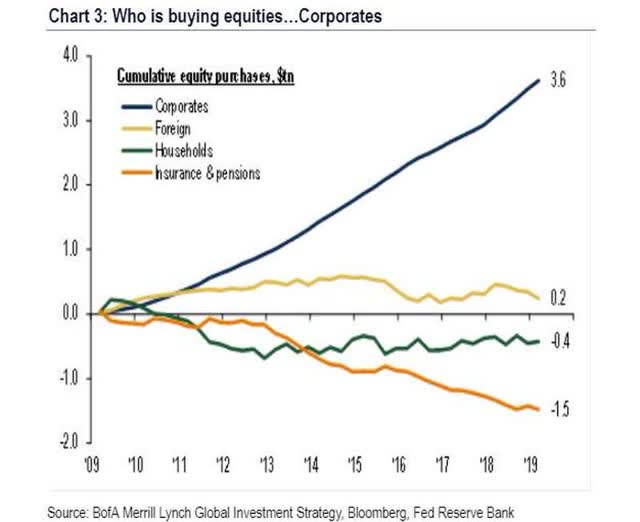
Who was buying? It may be that they were selling to themselves. From 2009 to 2019, corporations were by far the biggest buyers of their own stock.
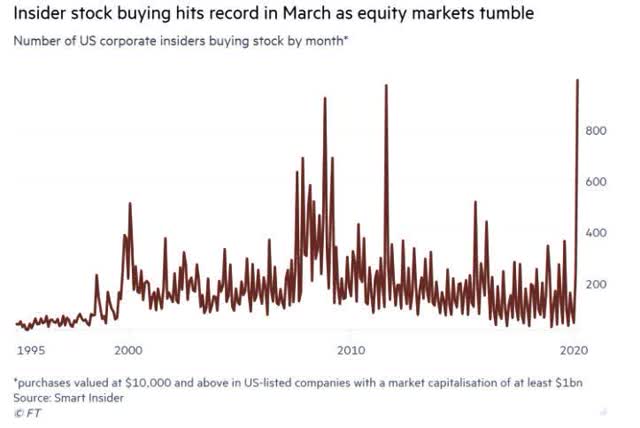
Insider stock buying was at a record peak during the March crash.
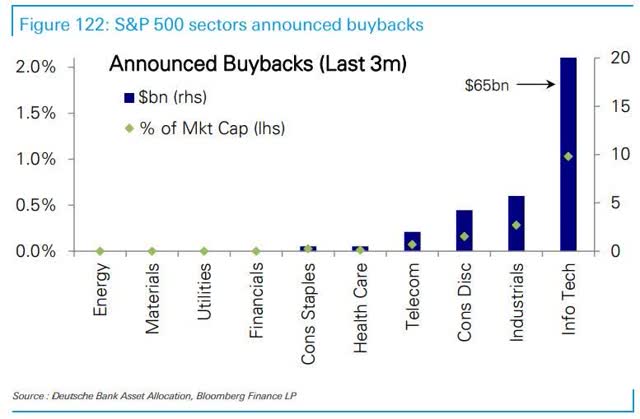
Information Technology has led the stock buyback announcement parade by a wide margin:
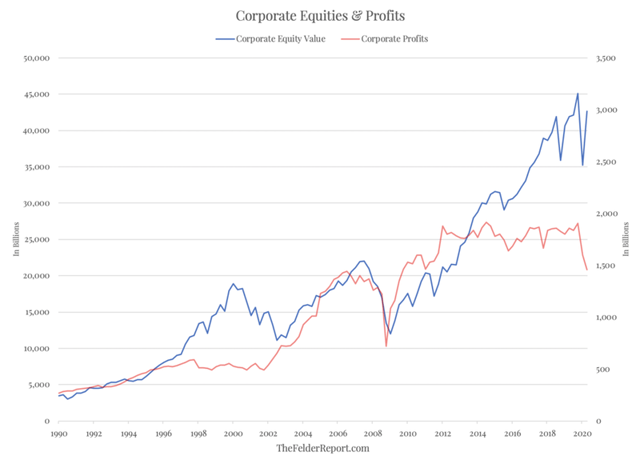
At Peak Financialization, corporations have engineered earnings per share, balance sheets and stock price in the face of declining profits and revenues:
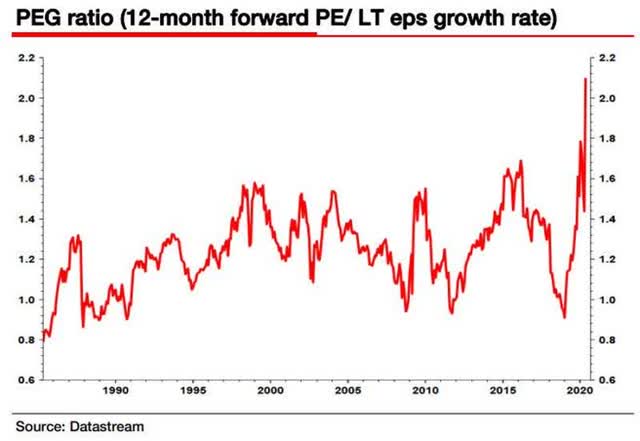
In the past, the game was played within the context of nominal economic growth and prosperity, but now, in the face of depression economic conditions, the ante has been upped. This is no doubt Peak Financialization.
What comes after Peak Financialization? Where do we go from here? As I have said in previous segments in this series, an Information-Based Economic System, Technocracy, Structural Unemployment and Universal Basic Income are some of the likely outcomes we can expect.
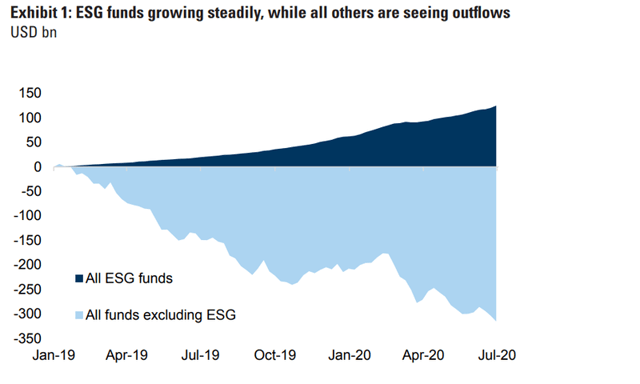
Here's an interesting peek into a new trend. Investment in Environmental, Social and Corporate Governance (ESG) sector funds have exploded since 2019 while all other equity funds excluding ESG have declined. What is ESG? When you strip away the feel-good marketing, it could be called the Technocracy sector.
In the next installment, I will probably start to map out some of the details about what an "information-based economic system" means.
Disclosure: I/we have no positions in any stocks mentioned, and no plans to initiate any positions within the next 72 hours. I wrote this article myself, and it expresses my own opinions. I am not receiving compensation for it. I have no business relationship with any company whose stock is mentioned in this article.
Need some help staying on the right side of the markets? Join the BullBear Traders room at TheBullBear.com. You'll get this kind of timely, incisive, unbiased stock and financial market trading, timing, forecasting and investment technical analysis and commentary daily. It's free to join, no credit card is required and if you like my work you just make a donation at the end of each month.

By Steve Vincent
Steven Vincent has been studying and trading the markets since 1998 and is a member of the Market Technicians Association. He is proprietor of BullBear Trading which provides market analysis, timing and guidance to subscribers. He focuses intermediate to long term swing trading. When he is not charting and analyzing the markets he teaches yoga and meditation in Los Angeles.
© 2011 Copyright Steven Vincent - All Rights Reserved Disclaimer: The above is a matter of opinion provided for general information purposes only and is not intended as investment advice. Information and analysis above are derived from sources and utilising methods believed to be reliable, but we cannot accept responsibility for any losses you may incur as a result of this analysis. Individuals should consult with their personal financial advisors.
© 2005-2022 http://www.MarketOracle.co.uk - The Market Oracle is a FREE Daily Financial Markets Analysis & Forecasting online publication.