


Stock Market Crash Capitulation Low?
Stock-Markets / Financial Crash Oct 13, 2008 - 09:16 AM GMTBy: Weekly_Wizards

 Our Wizards Mike Paulenoff, Harry Boxer and Jack Steiman weigh in this week on the direction of the markets.
According to Paulenoff, author of MPTrader.com : The most salient aspect of the weekly chart of the S&P 500 is that despite the fact that the index closed 60 points off of Friday's low, the index at 899.22 also closed 198 points from the week's high, which means that the net result of this week is downside continuation. Although I would not be surprised to see the SPX climb to 960-1000 sooner than later, I also think that another loop down to 839 must take place thereafter.
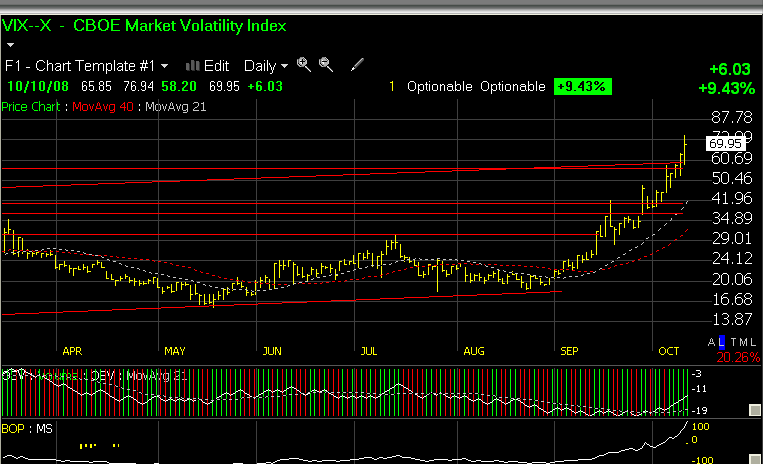
The S&P 500's opening down-spike to a multi-year low at 839.80 spiked the VIX into orbit that hit 70.90 early in the day before reaching a high of 76.94 in the afternoon. It is interesting to note that despite the rally in the SPX, the VIX remains extremely elevated at near 70, suggesting that investors remain very fearful of additional selling pressure on equities. This is a very good sign from a contrary perspective -- that the VIX has not reversed and plunged in the aftermath of what had the feel of a capitulation low.
In other words, even though the market rallied 350-400 Dow points at the time of my intraday chart snapshot and much more later in the day, the VIX continues to circle 70, giving me added "confidence" that the spike low, and rally in equities, likely has some shelf life this time, albeit amidst intense swings and volatility.
Moving to gold, as the streetTRACKS Gold Shares (GLD) continue to spiral lower -- closing at 83.22 from a high Friday of 90.72 -- I have to put Friday's action within the context of a big picture outlook to see how much damage has been inflicted by the day's weakness. When viewed from a weekly chart perspective, Friday's $5 (6%) decline feels worse than it looks. In fact, based on the weekly chart, current weakness represents a relatively minor pullback within a much larger dominant intermediate-term uptrend.
Be that as it may, the pain of the decline is palpable, but if I use my best efforts to remain objective, I still come to the conclusion that the GLD is "killing time" ahead of another upleg within the 2005-08 underlying bull trend.
According to Harry Boxer, author of TheTechTrader.com :
Today we're going to talk about various opportunities with in the market at such extreme lows, but first let's review the market conditions. This week we saw things I've never seen in my career, and I'm over 60. Starting off with fear readings, the VIX and VIXN exploded. The VIX has nearly quadrupled from around the 18 level to as high as nearly 77 in a period of six weeks. Those are historical numbers. The VIX did reach higher levels about 10-15 years ago, but the computation is different, so from a historical perspective these are record levels. The VIXN got to 82.42, also a record.
The McClellan Oscillator at -421 also is by far a record. The total amount of new lows in all exchanges was 5300, 2900 alone on the NYSE, 1500 on Nasdaq. This is unprecedented, and just in the past 5 days the S&P 500 was down 18.2%, the Nasdaq down 15.3%, and the NYSE Index down almost 20% at 19.5%. On top of that the Nasdaq volume of over 4.2 billion on Friday was the heaviest ever in one day. The past six days were basically the worst in market history in terms of decline, and seasonality-wise the lows for the month and quarter are due in this timeframe.
Not surprisingly, our short picks have done phenomenally. Looking at the list of short Charts of the Week we put out on July 7th, XEC dropped from 64 to 30, EOG from 120 to 54, GMXR from 76 to 21, CHK from 67 to 12, HK from 47 to 8, JRCC from 44 to 14, and US Steel from 155 down to 39 -- incredible profits in the Boxer Shorts list.
So with the oversold numbers the way they are, with the amount of losses we've had, and with the amount of panic we've had, this is certainly set up for being a very important low in this time frame. Whether it lasts another day or two is hard to say, but Friday's action being down sharply, rallying sharply, retesting and then rallying sharply before pulling back late -- that kind of volatility is also typical of market lows.
On the long side, I'm going to look at some ETFs here. The financials, which were the worst group going, had the biggest snapback on Friday. The Financial Select Sector (XLF) went from 12.79 to 15.10 and closed there at the exact high for the day, a big reversal on more than half a billion shares traded. Look at the 15-minute chart, you can see the reversal. It had been in very distinctive downtrend for the last six days, but late on Friday on big volume it burst to the upside. What I'm looking for on a snapback is 16 1/2, 18 1/4 and then up to about 20-20 1/2. Those are my short-term to swing-trade targets.
Next up is the Ultra QQQ ProShares (QLD), which is twice the QQQQ's. The 15-minute chart shows the very distinct downtrend it's been in in the last 10 days. Now it's snapped back to the top of that channel with big volume, but up to resistance and the declining tops line, so it technically has not broken out, but it's one to watch, though. I would not want to see it go below around 33, as 32.80 was the low on Thursday, and 33.31 was the low on Friday, and the moving average is right there. Targets are 39, 42 and 45 1/2.
The third ETF I like is the iShares MSCI Brazil (EWZ), which has had a huge decline. It's been in a very distinct down-channel, and also snapped back on Friday. Something to keep an eye on, as I believe the Brazilian exchange should have a sharp snapback. Targets are 40-40 1/2, 43 and then perhaps as high as 46 over the course of the next few weeks should we get the snapback I'm anticipating.
Lastly, the Ultra S&P 500 ProShares (SSO), the ultra S&P ProShares, has also been in a downtrend for quite a while, particularly the last six sessions. It may have double-bottomed and spiked up late on Friday. If this breaks out over 32.30, my targets are 35 and 38 for a short-term trade.
So, in short, I'm anticipating a strong snapback rally in the market over the next few days, and those are some opportunities.
According to Jack Steiman, author of SwingTradeOnline.com :
Why wasn't Friday a perfect reversal? Because the advance decline line wasn't right. Slightly more losers than gainers on the Nas but 2/1 negative on the Nyse. You want 2/1 or 3/1 advancers to decliners. I know Friday seemed exciting with such a massive reversal, but many stocks lagged badly and some were absolutely crushed. You won't see that when we make just the right reversal. The rally occurred for two reasons. Incredibly oversold and massive short covering ahead of the G7 meeting this weekend which will be a meeting to try and find more solutions for the current credit crisis. The shorts are afraid of them coming up with a solution that the market will like. They figure, hey, I've made a lot of money being short, I can take profits here ahead of the big meeting. If nothing comes out of the meeting, nothing substantial that is, then the market will likely fall right back down early next week. They'll likely take more short positions and more folks will sell their stocks. Just because we got a nice rebound Friday does not mean the selling is over.
I want all the right ingredients before entering back in again. I've learned over time that the market really doesn't change very much. It pretty much does what it's supposed to and that means all the right ingredients will be in place the day the market really bottoms for some time. It'll allow for one gorgeous counter trend rally that we can all enjoy but I feel Friday did not bring all the necessary ingredients together, sad as that may be. Close, but no cigar.
It's important to understand the depth of this bear market and why it already is different this time. We've had days of over 3000 new lows. We've had a record number of days on the Vix at levels never seen before in history. It's still very high. We've had a record level of losses in a very short period of time in terms of price. We have the worst bull bear percentage in terms of pessimism in history. We basically printed the highest level of the put call ratio you'll ever see.
The list goes on and on and is seemingly endless. In other words, with all of these realities upon us daily, the market still can't rally. It should already have long ago bottomed and a new bull begun but in this case, IT IS DIFFERENT THIS TIME!!! No matter what happens from here, it was different this time. There will always be something different in a persons lifetime that happens only once. You will never see anything like this again in your lifetimes but we are living it in the moment and we're all trying to figure out how to play it appropriately. There is also an anxiousness about getting in at the very bottom. We all want to do that. It's virtually impossible because we want to see a rally first that tells us we can nail this thing. This bear market is so bad and so different we have to be super sure before we get in. Even then there's no guarantee but you have to enter when all the signals come together and we will.
Sign up for a free 30-day trial to Jack Steiman's SwingTradeOnline.
For more of our Wizards, sign up for a Free Trial to their subscription services on our Sign-Up page.
http://www.advicetrade.com/Wizards
© 2002-2008 MPTrader.com, Weekly Wizards an AdviceTrade publication. All rights reserved. Any publication, distribution, retransmission or reproduction of information or data contained on this Web site without written consent from MPTrader is prohibited. See our disclaimer.
Weekly Wizards Archive |
© 2005-2022 http://www.MarketOracle.co.uk - The Market Oracle is a FREE Daily Financial Markets Analysis & Forecasting online publication.