


Platinum Tremd Forecast to Follow Gold Price Higher
Commodities / Platinum Sep 03, 2020 - 06:16 PM GMTBy: Chris_Vermeulen

RESEARCH HIGHLIGHTS:
- Platinum may be setting up in a technical pattern that is similar to the end of 2001/early 2002.
- Platinum could rally more than 300%, somewhere near $3,450 or higher.
- This might push Gold above $7,500 an ounce and may push silver somewhere north of $125 per ounce.
- Rally hinges on platinum breaking out above $1,050.50.
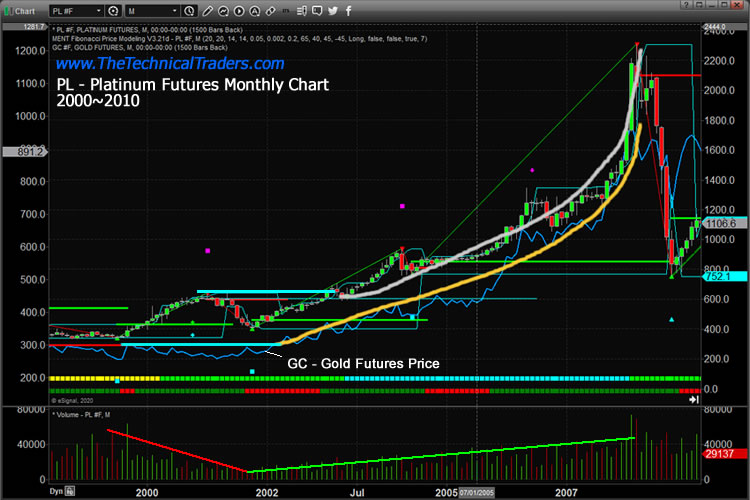
Platinum may be setting up in a technical pattern that is similar to the end of 2001/early 2002. At that time, Gold had already begun to rally above $340 and Platinum had rallied to levels above $600. Then, while Gold continued to rally, Platinum contracted to price levels near $400 on diminishing volume. Once that contraction was complete, Platinum began and upside price move with stronger volume levels which lasted almost seven years – reaching a peak above $2,300. Could the same setup be happening right now?
PLATINUM MIRRORING GOLD – JUST LIKE IT DID IN 2003
The upside price move in Gold may be the key to understanding the potential for an upside price move in Platinum. Gold has already rallied from $1,340 to over $1,000 over the past 12+ months while Platinum has moved lower from $2,000 to $800 and has recently started forming a rounded bottom formation. The deep price decline in Platinum in March 2020 setup a very deep low near $562. We believe the diminishing volume and deep low bottom setup in Platinum are mirroring the 2002 deep bottom setup and starting a potentially strong rally for Platinum.
This Platinum Monthly chart below shows the 2000 to 2010 rally, including the 2002 deep bottom setup and volume setup, suggests that once Platinum rallied above the previous high price level near $641, the opportunity for a continued upside price rally was consistent. We believe the basis for this move was the continued upside price rally in Gold. As Gold began to appreciate, Platinum continued to appreciate and trend higher – following Gold’s lead.
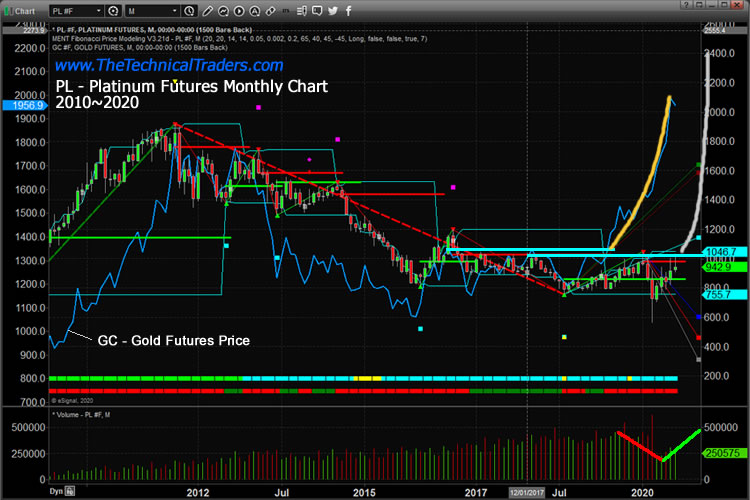
The current Platinum/Gold Monthly chart, below, shows a strong rounded bottom formation in Gold (the BLUE line on this chart) and the upside breakout in Gold that took place back in May 2019. Meanwhile, Platinum has extended a rounded bottom formation and recently set up a very deep spike price low with the COVID-19 price collapse.
Before you continue, be sure to opt-in to our free-market trend signalsnow so you don’t miss our next special report!
My team and I believe once Platinum breaks above the $1,050.50 level on increasing trading volume while Gold continues to rally, a larger upside price trend will setup in both Gold and Platinum that could mirror what happened from 2004 through 2010. This would suggest Gold could rally more than 400% from current levels and Platinum could rally more than 300% from current levels.
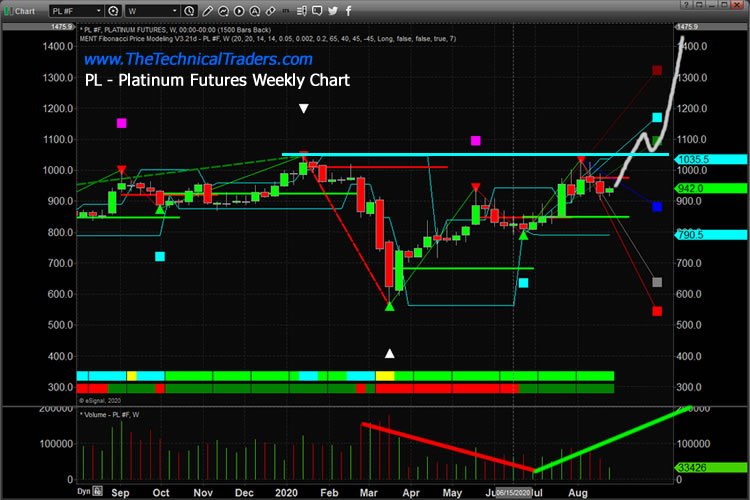
The following Weekly Platinum chart highlights the setup in Platinum we believe may prompt a big upside breakout move soon. The diminishing volume throughout a downside price trend – followed by increasing volume throughout a recovery, and eventual breakout of the resistance level near $1,050.50. We would watch for Gold to continue to rally over the next 12+ weeks, while the volume levels increase in Platinum as it attempts to close in on the $1,050.50 price level. Once that level is breached to the upside, we would expect volume levels to continue to increase (on average) as both Gold and Platinum are considered as a “pair of fear hedge metals” and continue to rally up to a peak.
If we are correct in our interpretation of the pattern, then a 400% rally in Gold from the breakout level in Platinum would put the Gold peak price level somewhere above $7,500 or higher. This would put the Platinum peak level somewhere near $3,450 or higher.
As many of you may already know, we love the metals and we love to apply our technical analysis skills and pattern research onto these charts. Could you imagine the scope of the rally that is setting up in Platinum mirrors the 2003 to 2010 price rally – just waiting for this breakout pattern to complete?
Get ready because this could be one over the biggest upside price moves in precious metals that anyone has ever seen since the 2003 to 2010 rally. This might push Gold above $7,500 an ounce and may push Platinum above $3,400 per ounce. Guess where Silver prices should be at those levels?? (we’ll give you a hint: somewhere north of $125 per ounce).
If you found this informative, then sign up now to get a pre-market video every day before the opening bell that walks you through the charts and my proprietary technical analysis of all of the major assets classes. You will also receive my easy-to-follow ETF swing trades that always include an entry price, a stop, two exit targets, as well as a recommended position sizing. Visit my Active ETF Trading Newsletter to learn more.
While many of you have trading accounts, our most important accounts are long-term buy-and-hold investment accounts. Our signals can help you preserve and even grow your long term capital. If you have any type of long-term investment or retirement account and are looking for signals as to when to own equities, bonds, or cash, be sure to become a member of my Long-Term Investing Signals, which includes a weekly market update and trade alerts.
Chris Vermeulen
www.TheTechnicalTraders.com
Chris Vermeulen has been involved in the markets since 1997 and is the founder of Technical Traders Ltd. He is an internationally recognized technical analyst, trader, and is the author of the book: 7 Steps to Win With Logic
Through years of research, trading and helping individual traders around the world. He learned that many traders have great trading ideas, but they lack one thing, they struggle to execute trades in a systematic way for consistent results. Chris helps educate traders with a three-hour video course that can change your trading results for the better.
His mission is to help his clients boost their trading performance while reducing market exposure and portfolio volatility.
He is a regular speaker on HoweStreet.com, and the FinancialSurvivorNetwork radio shows. Chris was also featured on the cover of AmalgaTrader Magazine, and contributes articles to several leading financial hubs like MarketOracle.co.uk
Disclaimer: Nothing in this report should be construed as a solicitation to buy or sell any securities mentioned. Technical Traders Ltd., its owners and the author of this report are not registered broker-dealers or financial advisors. Before investing in any securities, you should consult with your financial advisor and a registered broker-dealer. Never make an investment based solely on what you read in an online or printed report, including this report, especially if the investment involves a small, thinly-traded company that isn’t well known. Technical Traders Ltd. and the author of this report has been paid by Cardiff Energy Corp. In addition, the author owns shares of Cardiff Energy Corp. and would also benefit from volume and price appreciation of its stock. The information provided here within should not be construed as a financial analysis but rather as an advertisement. The author’s views and opinions regarding the companies featured in reports are his own views and are based on information that he has researched independently and has received, which the author assumes to be reliable. Technical Traders Ltd. and the author of this report do not guarantee the accuracy, completeness, or usefulness of any content of this report, nor its fitness for any particular purpose. Lastly, the author does not guarantee that any of the companies mentioned in the reports will perform as expected, and any comparisons made to other companies may not be valid or come into effect.
Chris Vermeulen Archive |
© 2005-2022 http://www.MarketOracle.co.uk - The Market Oracle is a FREE Daily Financial Markets Analysis & Forecasting online publication.