A Simple Way to Preserve Your Wealth Amid Uncertainty
Commodities / Gold & Silver 2020 Aug 11, 2020 - 06:40 PM GMTBy: Nick_Barisheff
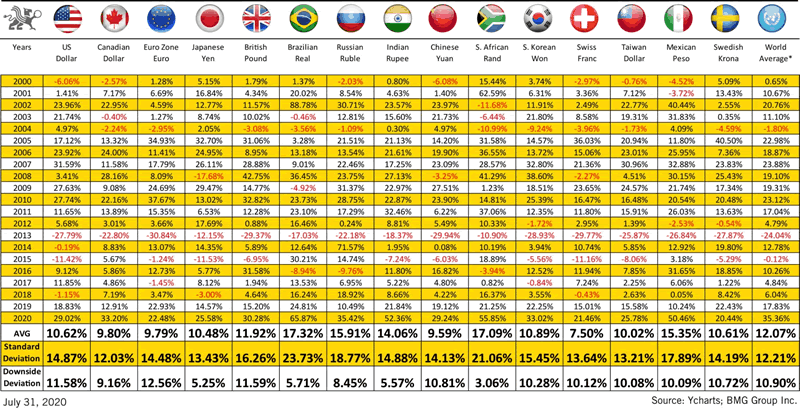
The term ‘unprecedented’ has been used to explain 2020 throughout the world. Whether it be the simultaneous triple bubble that is currently being experienced within equity, bond, and real estate markets, or the volume of quantitative easing deployed by central banks in order to combat Covid-19, 2020 has been an unprecedented year thus far to say the least. Safety and stability of capital has been difficult to find, as many volatility indicators, such as the VIX, continue to point towards future uncertainty. Gold, however, has gone against the grain in 2020, as it has continued its strong historical performance and has done an excellent job at preserving wealth. As of July 31, 2020, gold has appreciated 29.02% in US dollars (USD) and 33.20% in Canadian dollars (CAD). These results should not come as a surprise to investors, as gold has increased an average of 10.6% (USD) and 9.8% (CAD) since 2000. With tremendous upside available for gold amid future uncertainty within the markets, and a proven historical track record of strong performance, it is surprising that gold does not hold a larger allocation size within most investor portfolios.

Chart 1 demonstrates the superior performance of gold over the last 20 years, regardless of which currency is selected for holding gold. Across major currencies, the average annual return throughout the time period is 12.07%.
The economies of the world are handling the elevated levels of uncertainty associated with the pandemic in different manners. Determining which economies will pick up first, and thus strengthen their currency, is hard to determine. However, making the decision to simply hold gold regardless of currency has proven to be a prudent decision for personal wealth management. With the United States continuing quantitative easing and abusing their power as a reserve currency within the global economy, there continues to be an excellent opportunity for gold appreciation.
Speaking of the exceptional performance of gold throughout the last 20 years is relatively meaningless without comparing it to the performance of other commonly purchased assets. To put gold’s historical performance into better perspective, an analysis was completed to compare the risk and returns from various asset classes.

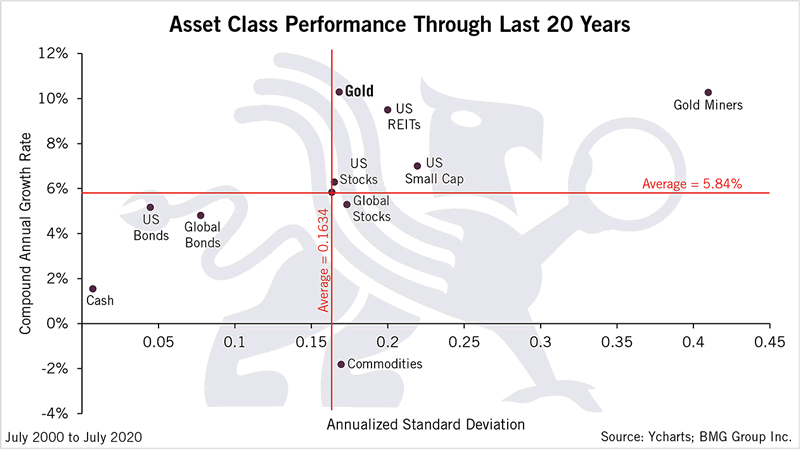
Chart 2[1] displays the volatility and return of major asset classes throughout the last 20 years. The calculation used for returns is calculated using the compound annual growth rate (CAGR), while risk is measured using annualized standard deviation (from monthly price changes throughout the period). The CAGR is the rate of return assuming that profits were reinvested at the end of each year over an investment’s lifespan.
Throughout the asset classes under observation, the average CAGR was 5.84% while the average standard deviation was 0.1634. As demonstrated, gold outperformed the average, as it yielded a 10.3% CAGR during the observation period. None of the asset classes under observation achieved higher returns throughout the time period. The only asset classes to provided similar returns were gold miners (10.3%) and US REITs (9.5%). However, both alternatives come with enhanced risk due to the higher standard deviations. The 0.1682 standard deviation of gold was only slightly higher than the average of 0.1634, while gold miners displayed a 0.4096 standard deviation during the same time frame. Taking both risk and return into consideration shows that gold has been an optimal asset class for bolstering wealth preservation over the last 20 years. However, not every way of holding gold offers the same results. Physical bullion provides the optimal mix of risk and return for investors.
Over the years, one of the major misconceptions that I have come across while advocating the benefits of adding physical gold to investors’ portfolios is that they already have an allocation designated for gold. Most of these allocations are to commodities or gold miners.

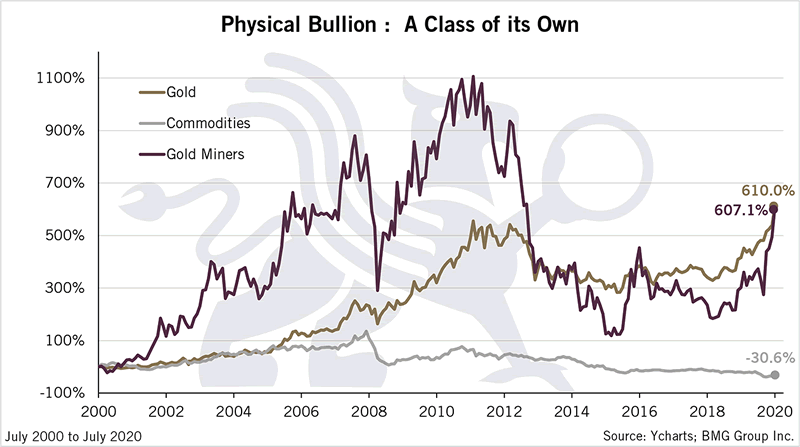
As displayed in Chart 3, disregarding physical bullion and utilizing alternative methods would have been detrimental to investors over the last 20 years. Physical bullion is the optimal method for holding gold when compared to both the Bloomberg Commodity Index (BCOM) and the NYSE ARCA Gold BUGS index (HUI).
BCOM is the most widely used benchmark for the commodities market, tracked by approximately $85 billion in assets. Within the index, gold is the highest-weighted constituent at 12.24%[1]. The index has negative returns of -30.6%, which clearly indicates that holding commodities within a portfolio should not be considered as the equivalent to holding physical bullion. On the contrary, the HUI index is comprised of the 15 largest and most recognized publicly traded gold production companies. Although the index displayed tremendous upside from 2000 to 2010, the dangers of high levels of volatility were displayed, as prices have yet to recover from the steep drop-off experienced following 2012. Throughout the 20-year period, the standard deviation using monthly changes in prices indicates that physical bullion provides investors with a higher return and less risk, thus providing enhanced security to investors seeking wealth preservation. Physical bullion had a standard deviation of 0.1670 compared to 0.4094 for the HUI index. Evidently, holding commodities or gold miners within a portfolio should not be considered an equivalent to purchasing physical bullion. Physical bullion clearly makes a convincing case to be added to investors portfolios not only for diversification benefits, but also for strong historical returns of 610% over the last 20 years.
Traditionally, gold advocates and investors tend to evaluate portfolio performance by introducing increments of gold into their portfolio. Evidence can be found from various sources and our past articles, which describe how adding gold to your portfolio can increase returns and reduce overall risk. These measures typically focus on allocating a range between 2% and 10% in order to create a truly balanced portfolio. However, the purpose of this article is to flip this traditional approach over. We will evaluate the performance of various portfolios that begin with a 100% gold allocation, then compare the performance of other portfolios with incrementally lower allocations of gold used within the portfolio.
The first eight columns in Chart 4A display the allocation sizes for each of the respective portfolios, whereas the final two columns show the CAGR and standard deviation. Each of the assets was given an equal weighting based on available capital remaining after the specified gold allocation. Cash never surpassed an allocation of 2% and was not given an equal weighting with the remainder of the asset classes.

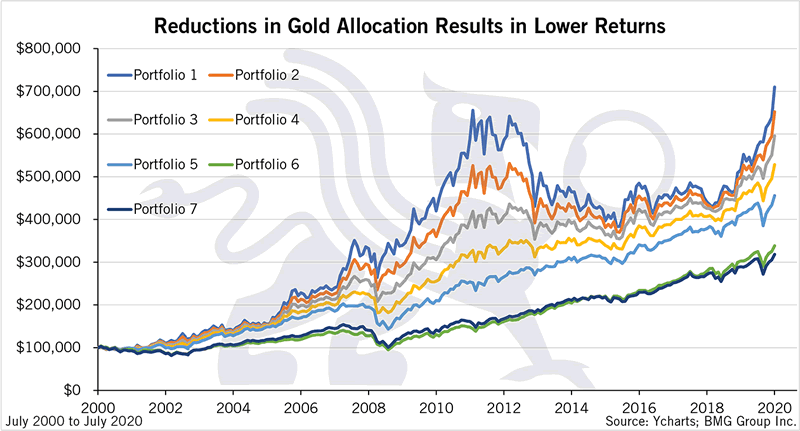
As displayed in Chart 4A, a 100% allocation to gold (portfolio 1) would have provided the highest CAGR of 10.3%. Each reduction in gold allocation results in a lower compounded annual growth rate for each portfolio throughout the observable time period. Comparatively speaking, portfolio 6 and 7 represent traditional 60/40 portfolios consisting of only stocks and bonds. Choosing to hold 100% gold over the 20-year period rather than investing in a traditional 60/40 portfolio would have been the most beneficial decision for wealth preservation.

Chart 4B displays the performance of the 7 portfolios under observation assuming an initial investment of $100,000. Portfolio 1 would have turned the $100,000 investment into $709,991 by the end of the time-period.
On the contrary, portfolio 6, which holds constituents of a typical 60/40 portfolio, would have yielded $338,308 during the same time period. That is a difference of $371,683, or over $18,500 per year. Holding 100% physical bullion throughout the time period displays the best benefits for wealth preservation, as the monetary difference between the portfolios is more than double. At BMG Group, we have continuously advocated the addition of gold to traditional 60/40 portfolios, and the rationale is clear. Gold provides significantly higher returns for your portfolio.
In conclusion, it is evident that holding gold should be a priority for investors considering the looming economic uncertainty within the economy, as well as the historically superior performance of gold over the last 20 years. It would be naïve for investors to continue ignoring the benefits of adding physical bullion to their portfolios during these turbulent times.
By Nick Barisheff
Nick Barisheff is the founder, president and CEO of Bullion Management Group Inc., a company dedicated to providing investors with a secure, cost-effective, transparent way to purchase and hold physical bullion. BMG is an Associate Member of the London Bullion Market Association (LBMA).
Widely recognized as international bullion expert, Nick has written numerous articles on bullion and current market trends, which have been published on various news and business websites. Nick has appeared on BNN, CBC, CNBC and Sun Media, and has been interviewed for countless articles by leading business publications across North America, Europe and Asia. His first book $10,000 Gold: Why Gold’s Inevitable Rise is the Investors Safe Haven, was published in the spring of 2013. Every investor who seeks the safety of sound money will benefit from Nick’s insights into the portfolio-preserving power of gold. www.bmgbullion.com
© 2020 Copyright Nick Barisheff - All Rights Reserved Disclaimer: The above is a matter of opinion provided for general information purposes only and is not intended as investment advice. Information and analysis above are derived from sources and utilising methods believed to be reliable, but we cannot accept responsibility for any losses you may incur as a result of this analysis. Individuals should consult with their personal financial advisors.
© 2005-2022 http://www.MarketOracle.co.uk - The Market Oracle is a FREE Daily Financial Markets Analysis & Forecasting online publication.


