


NATURAL GAS BEGINS UPSIDE BREAKOUT MOVE
Commodities / Natural Gas Aug 07, 2020 - 02:32 PM GMTBy: Chris_Vermeulen

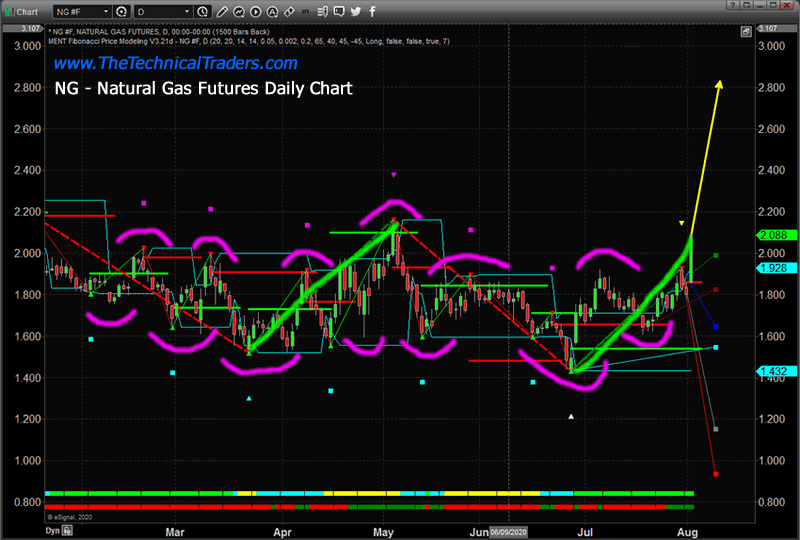
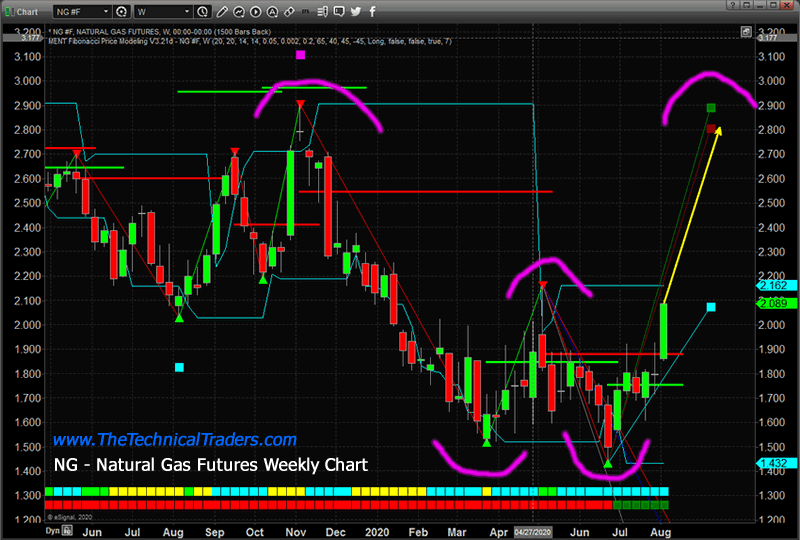
First, we want to say “It took long enough!” and we’re happy to see this upside move in Natural Gas. We had been calling this move for many months. Our predictive modeling systems and cycle systems suggested the extended bottoming formation in Natural Gas was an excellent opportunity for skilled technical traders. Today’s big move suggests the downside price pressure is dissipating and a new bullish price trend may push Natural Gas prices above $2.85 quickly.
Our research team spotted this potential setup in April and May articles where we correctly predicted an NG rally in April (it did!) and new upside targets for NG in May. We have been keeping our subscribers up-to-date with UNG as this bottom has played out.
The upside move in late April 2020 was a cycle move that we expected to continue a bit higher. It still presented a very nice opportunity for skilled traders to capture a 35% upside price swing. The current, deeper, price bottom near $1.43, represents a very deep rotational bottom in Natural Gas and the current upside price move may be just starting. Our researchers believe the initial target for this move is $2.85. After that level is reached, if the trend continues, a higher target near $3.65 could become a very real price target.
Before you continue, be sure to opt-in to our free-market trend signals now so you don’t miss our next special report!
NATURAL GAS RISE IS STARTING EARLY
Historically, August has not been an impressive month for Natural Gas. Over the past 24~25 years, August represents a muted average upside range of $0.52 and an average downside range of -$0.73. These monthly historical cycles suggest an almost even split with 12 months moving higher and 13 months moving lower. Yet, when we move to September, things change.
September on the other hand has historically presented a very strong upside potential in Natural Gas with an average upside range of $0.69 and an average downside range of -$0.22. This suggests the upside potential in September is nearly 300% larger than the downside potential. Additionally, over the past 24 years, Natural Gas has moved higher 16 months and lower only 8 months. This suggests the upside price rally in September is nearly a 2:1 certainty.
Quite possibly, the extended bottoming formation in Natural Gas over the past 3+ months is setting up an early rally mode where price levels may move towards our $2.85 price target, then stall headed into September. Once September arrives, Natural Gas prices may begin another upside move pushing well above the $3.50 level.
The $2.16 level represents critical resistance right now. It is very likely that prices will stall near this level before attempting a bigger move higher. Supply issues may present a situation where prices breach this level quickly though. Once the buying rally sets in, Natural Gas can move very quickly, over a few weeks, to incredible peak levels.
Skilled traders who were able to navigate this bottom and get into positions in UNG or futures will likely be very pleased with what we believe will be a moderately easy 40% upside move. The UNG trade will begin to accelerate higher as Natural Gas clears the $2.85 price level.
Play this trade cautiously as it progresses – pulling 30% to 60% of profits moderately early to protect against the eventual “peak and sell-off”. If you know anything about Natural Gas in a rally mode, it should be that the peaks can be incredible, but the eventual sell-off can be very quick and dangerous. Take your profits and be happy you caught a good trade.
September may be a big surprise for NG traders with a really nice upside price move that no one expects right now if our research is correct.
Get our Active ETF Swing Trade Signals or if you have any type of retirement account and are looking for signals when to own equities, bonds, or cash, be sure to become a member of my Passive Long-Term ETF Investing Signals which we are about to issue a new signal for subscribers.
Chris Vermeulen
www.TheTechnicalTraders.com
Chris Vermeulen has been involved in the markets since 1997 and is the founder of Technical Traders Ltd. He is an internationally recognized technical analyst, trader, and is the author of the book: 7 Steps to Win With Logic
Through years of research, trading and helping individual traders around the world. He learned that many traders have great trading ideas, but they lack one thing, they struggle to execute trades in a systematic way for consistent results. Chris helps educate traders with a three-hour video course that can change your trading results for the better.
His mission is to help his clients boost their trading performance while reducing market exposure and portfolio volatility.
He is a regular speaker on HoweStreet.com, and the FinancialSurvivorNetwork radio shows. Chris was also featured on the cover of AmalgaTrader Magazine, and contributes articles to several leading financial hubs like MarketOracle.co.uk
Disclaimer: Nothing in this report should be construed as a solicitation to buy or sell any securities mentioned. Technical Traders Ltd., its owners and the author of this report are not registered broker-dealers or financial advisors. Before investing in any securities, you should consult with your financial advisor and a registered broker-dealer. Never make an investment based solely on what you read in an online or printed report, including this report, especially if the investment involves a small, thinly-traded company that isn’t well known. Technical Traders Ltd. and the author of this report has been paid by Cardiff Energy Corp. In addition, the author owns shares of Cardiff Energy Corp. and would also benefit from volume and price appreciation of its stock. The information provided here within should not be construed as a financial analysis but rather as an advertisement. The author’s views and opinions regarding the companies featured in reports are his own views and are based on information that he has researched independently and has received, which the author assumes to be reliable. Technical Traders Ltd. and the author of this report do not guarantee the accuracy, completeness, or usefulness of any content of this report, nor its fitness for any particular purpose. Lastly, the author does not guarantee that any of the companies mentioned in the reports will perform as expected, and any comparisons made to other companies may not be valid or come into effect.
Chris Vermeulen Archive |
© 2005-2022 http://www.MarketOracle.co.uk - The Market Oracle is a FREE Daily Financial Markets Analysis & Forecasting online publication.