Stock Market Capitulation Low?
Stock-Markets / Financial Crash Oct 11, 2008 - 02:25 PM GMTBy: Mike_Paulenoff

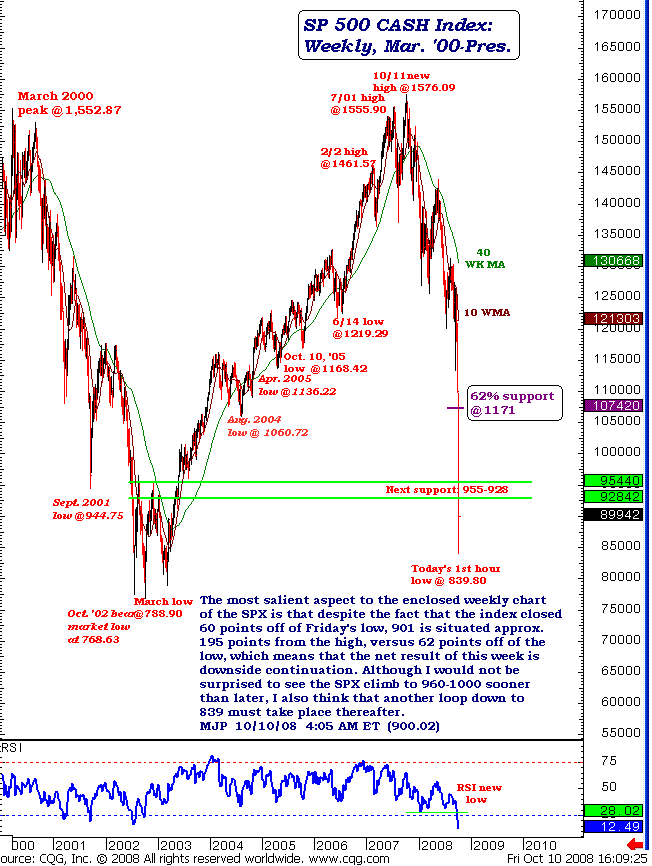
 The most salient aspect of the weekly chart of the S&P 500 is that despite
the fact that the index closed 60 points off of Friday's low, the index at
899.22 also closed 198 points from the week's high, which means that the net
result of this week is downside continuation. Although I would not be
surprised to see the SPX climb to 960-1000 sooner than later, I also think
that another loop down to 839 must take place thereafter.

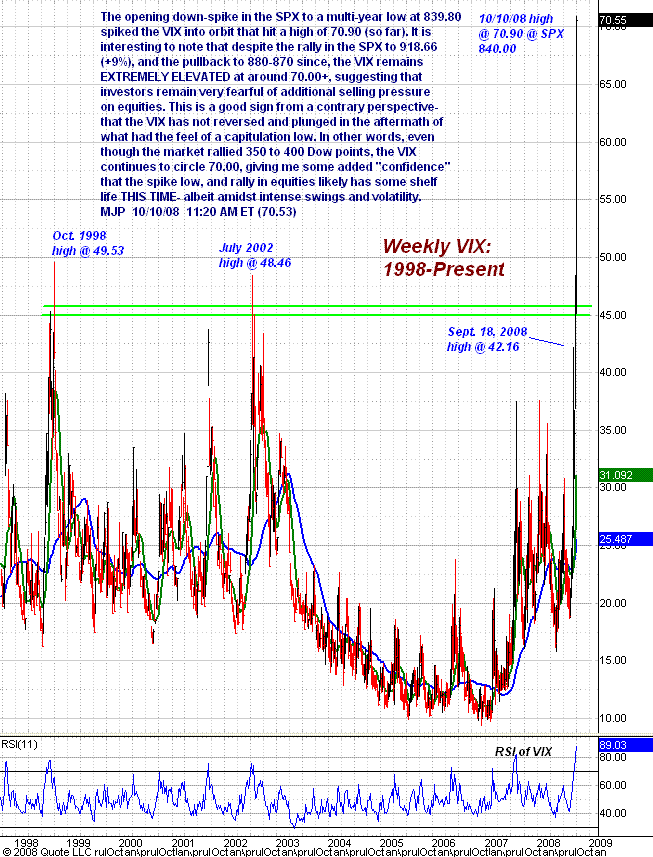
The S&P 500's opening down-spike to a multi-year low at 839.80 spiked the VIX into orbit that hit 70.90 early in the day before reaching a high of 76.94 in the afternoon. It is interesting to note that despite the rally in the SPX, the VIX remains extremely elevated at near 70, suggesting that investors remain very fearful of additional selling pressure on equities. This is a very good sign from a contrary perspective -- that the VIX has not reversed and plunged in the aftermath of what had the feel of a capitulation low.
In other words, even though the market rallied 350-400 Dow points at the time of my intraday chart snapshot and much more later in the day, the VIX continues to circle 70, giving me added "confidence" that the spike low, and rally in equities, likely has some shelf life this time, albeit amidst intense swings and volatility.

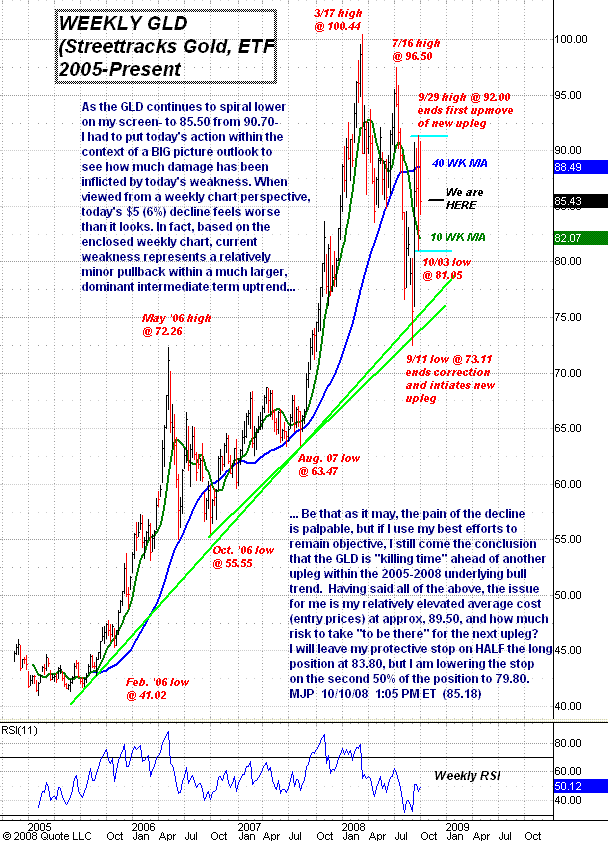
Moving to gold, as the streetTRACKS Gold Shares (GLD) continue to spiral lower -- closing at 83.22 from a high Friday of 90.72 -- I have to put Friday's action within the context of a big picture outlook to see how much damage has been inflicted by the day's weakness. When viewed from a weekly chart perspective, Friday's $5 (6%) decline feels worse than it looks. In fact, based on the weekly chart, current weakness represents a relatively minor pullback within a much larger dominant intermediate-term uptrend.
Be that as it may, the pain of the decline is palpable, but if I use my best efforts to remain objective, I still come to the conclusion that the GLD is "killing time" ahead of another upleg within the 2005-08 underlying bull trend.

Sign up for a free 15-day trial to Mike's ETF Trading Diary today.
By Mike Paulenoff
Mike Paulenoff is author of the MPTrader.com (www.mptrader.com) , a real-time diary of Mike Paulenoff's trading ideas and technical chart analysis of Exchange Traded Funds (ETFs) that track equity indices, metals, energy commodities, currencies, Treasuries, and other markets. It is for traders with a 3-30 day time horizon, who use the service for guidance on both specific trades as well as general market direction
© 2002-2008 MPTrader.com, an AdviceTrade publication. All rights reserved. Any publication, distribution, retransmission or reproduction of information or data contained on this Web site without written consent from MPTrader is prohibited. See our disclaimer.
Mike Paulenoff Archive |
© 2005-2022 http://www.MarketOracle.co.uk - The Market Oracle is a FREE Daily Financial Markets Analysis & Forecasting online publication.


