US Dollar Cycle Review
Currencies / US Dollar Jul 27, 2020 - 05:21 PM GMTBy: readtheticker
If investors can correctly forecast the US Dollar then their portfolio will be standing on better ground.
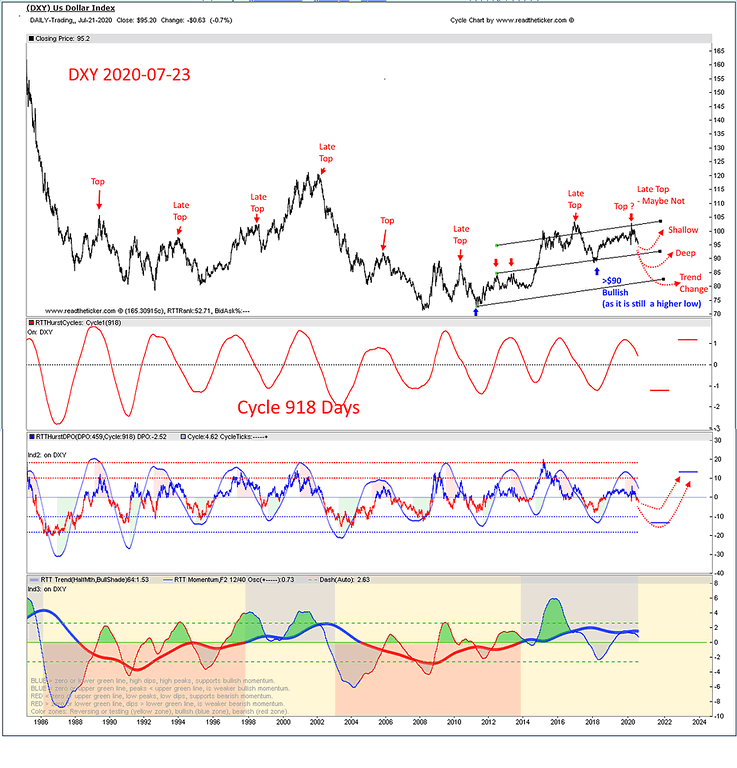
Jesse Livermore said investors must familiarise themselves with all matters of the market. The sine wave cycle below shows regular tops and bottoms and if the investor ignores this repeating phenomena it could be at their peril. If you decide to do so, you best have a good technical or fundamental reason.
The sine wave cycle below was found with readtheticker.com 'Cycle Finder Spectrum' use of 'Bartels' logic. Yes it is mathematics, but within the site RTT Plus service we also examine the dollar fundamentals (like: inflation, money supply, banking risk, interest rates, market risk) and subject to another market like COVID19 smash the fundamentals suggest a slump in the US dollar in the immediate short term future.
The question remains how deep the dollar slump is likely to be. Cycle are good for forecasting periods of peaks and troughs, the size of the extension or the depth of a slump is a little more tricky, and if the DXY holds above $90 then a bullish pattern remains as a higher low remains, below will make life very interesting.
A lower US dollar does act as stimulus to risk on assets, and it is no surprise the current Trump White House welcomes higher asset prices prior to November 2020 elections. Yes! You can accept the white glove of the White House inked up the printing presses to make it so, and we can assume they have gallons of ink.
Chart Review ..
- Sine Wave cycle
- Sine Wave with DPO (Detrending Price Osc)
- Momentum Osc synced with cycles.

Fundamentals are important, and so is market timing, here at readtheticker.com we believe a combination of Gann Angles, Cycles, Wyckoff and Ney logic is the best way to secure better timing than most, after all these methods have been used successfully for 70+ years. To help you applying Richard Wyckoff and Richard Ney logic a wealth of knowledge is available via our RTT Plus membership. NOTE: readtheticker.com does allow users to load objects and text on charts, however some annotations are by a free third party image tool named Paint.net Investing
NOTE: readtheticker.com does allow users to load objects and text on charts, however some annotations are by a free third party image tool named Paint.net
Readtheticker
My website: www.readtheticker.com
We are financial market enthusiast using methods expressed by the Gann, Hurst and Wyckoff with a few of our own proprietary tools. Readtheticker.com provides online stock and index charts with commentary. We are not brokers, bankers, financial planners, hedge fund traders or investment advisors, we are private investors
© 2020 Copyright readtheticker - All Rights Reserved
Disclaimer: The material is presented for educational purposes only and may contain errors or omissions and are subject to change without notice. Readtheticker.com (or 'RTT') members and or associates are NOT responsible for any actions you may take on any comments, advice,annotations or advertisement presented in this content. This material is not presented to be a recommendation to buy or sell any financial instrument (including but not limited to stocks, forex, options, bonds or futures, on any exchange in the world) or as 'investment advice'. Readtheticker.com members may have a position in any company or security mentioned herein.
© 2005-2022 http://www.MarketOracle.co.uk - The Market Oracle is a FREE Daily Financial Markets Analysis & Forecasting online publication.


