


This Stock Market Indicator Reaches "Lowest Level in Nearly 20 Years"
Stock-Markets / Stock Markets 2020 Jul 26, 2020 - 07:35 PM GMTBy: EWI

Here's what happened "the last time the 10-day put/call ratio made a lower extreme"
After a big trend reversal, it's not unusual for the correction to retrace much of the initial sell-off or rally.
Thus, many investors are fooled into believing that the old trend has resumed.
This quote from the Elliott Wave Financial Forecast, a monthly publication which provides analysis of key U.S. financial markets, explains how this phenomenon often plays out in bear markets:
Conditions at the [first countertrend rally] high often seem as good if not better than they were at the bull-market peak. This is certainly how investors feel now, as the sentiment figures attest. Surveys show nearly as many bulls as they did at the [bull market] high.
No, this quote is not from 2020, but from the April 2000 issue of the Financial Forecast.
At the time, the stock market was in the early phase of a big bear market.
There's a good reason for bringing this subject up now in mid-2020.
This July 19 CNBC quote provides insight:
Bullishness among investors with $1 million or more in a brokerage account they self-manage was up 13% from last quarter, according to the latest E-Trade Financial investor survey, from 41% to 54%.
And, our July 15, 2020 U.S. Short Term Update provides another perspective on investor sentiment. Here's a chart and commentary:
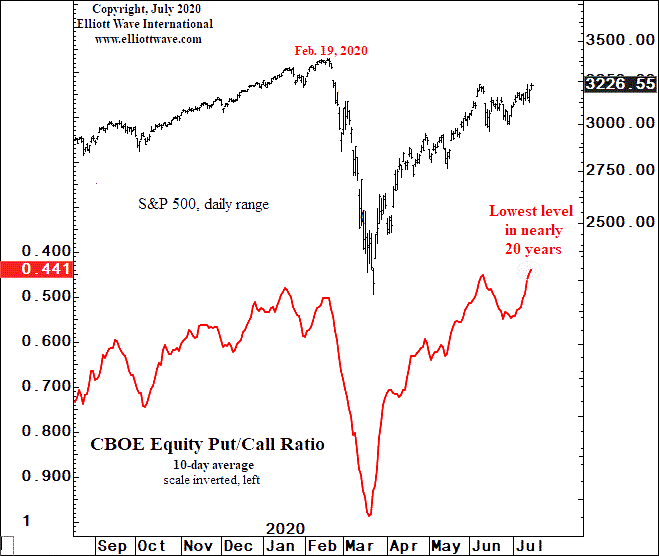
The 10-day CBOE equity put/call ratio is at .441. Not only is this a new extreme for the rally, exceeding also the peak reading at the February 19, 2020 top, but it's the lowest 10-day average in nearly 20 years. The last time the 10-day p/c [ratio] made a lower extreme (.418) was on September 7, 2000...
Now, do understand that sentiment extremes can become even more extreme. That's another way of saying that the CBOE equity put/call ratio is not a precise investment timing indicator.
However, sentiment extremes are useful in putting investors "on notice" to pay close attention to the market's Elliott wave pattern, which does offer more precision.
As the Wall Street classic book, Elliott Wave Principle: Key to Market, states:
Although it is the best forecasting tool in existence, the Wave Principle is not primarily a forecasting tool; it is a detailed description of how markets behave. Nevertheless, that description does impart an immense amount of knowledge about the market's position within the behavioral continuum and therefore about its probable ensuing path. The primary value of the Wave Principle is that it provides a context for market analysis. This context provides both a basis for disciplined thinking and a perspective on the market's general position and outlook. At times, its accuracy in identifying, and even anticipating, changes in direction is almost unbelievable.
You can learn how to use the Elliott wave model.
It's as simple as reading the online version of Elliott Wave Principle: Key Market -- 100% free.
The way to gain instant and free access is to join Club EWI -- which is an Elliott Wave International educational community. Membership is also free and offers benefits.
Besides free access to Elliott Wave Principle: Key to Market Behavior, you'll also be able to tap into trading, investing and financial markets insights -- straight from Elliott Wave International's team of analysts.
Go for it!
Just follow this link: Elliott Wave Principle: Key to Market Behavior.
This article was syndicated by Elliott Wave International and was originally published under the headline This Stock Market Indicator Reaches "Lowest Level in Nearly 20 Years". EWI is the world's largest market forecasting firm. Its staff of full-time analysts led by Chartered Market Technician Robert Prechter provides 24-hour-a-day market analysis to institutional and private investors around the world.
© 2005-2022 http://www.MarketOracle.co.uk - The Market Oracle is a FREE Daily Financial Markets Analysis & Forecasting online publication.