


Retail Stock Market Traders & Investors Squeezed to Buy High-Risk Assets Again
Stock-Markets / Stock Markets 2020 Jul 15, 2020 - 12:33 PM GMTBy: Chris_Vermeulen

Yes, we certainly live in interesting times. This, the last segment of our multi-part article on the current Q2 and Q3 2020 US and global economic expectations, as well as current data points, referencing very real ongoing concerns, we urge you to continue using common sense to help protect your assets and families from what we believe will be a very volatile end to 2020. If you missed the first two segments of this research article, please take a moment to review them before continuing.
On May 24th, 2020, we published this research article related to our super-cycle research. It is critical that you understand what is really happening in the world as we move through these major 21 to 85+ year super-cycles and apply that knowledge to the data we have presented in the first two segments of this research post. Within that article, we quoted Ray Dalio from a recent article published related to his cycle research.
“In brief, after the creation of a new set of rules establishes the new world order, there is typically a peaceful and prosperous period. As people get used to this they increasingly bet on the prosperity continuing, and they increasingly borrow money to do that, which eventually leads to a bubble. As prosperity increases the wealth gap grows. Eventually, the debt bubble bursts, which leads to the printing of money and credit and increased internal conflict, which leads to some sort of wealth redistribution revolution that can be peaceful or violent. Typically at that time late in the cycle, the leading empire that won the last economic and geopolitical war is less powerful relative to rival powers that prospered during the prosperous period, and with the bad economic conditions and the disagreements between powers, there is typically some kind of war. Out of this debt, economic, domestic, and world-order breakdowns that take the forms of revolutions and wars come new winners and losers. Then the winners get together to create the new domestic and world orders.”
That rather chilling statement suggests one thing that we all need to be aware of at this time: what the current and future economic cycles will likely present and how the world will navigate through this process of a cycle transition.
Before you continue, be sure to opt-in to our free-market trend signals berfore closing this page, so you don’t miss our next special report!
In our opinion, the massive cycle event that is taking place may not disrupt world order as Mr. Dalio suggests. There is a very strong likelihood that credit/debt processes may become the “collateral damage” of this cycle transition, but not much else changes. The world order and powerful nations across the globe are keenly aware that starting WWIII because of a credit/debt crisis is not in anyone’s interest. The world has enough capability to address these concerns without blowing the planet to pieces in the process.
Our super-cycle research suggests we have entered a period that is very similar to 1919~1920 – a “roaring good time” most likely has already extended beyond reasonable levels. Our research suggests a massive peak in cycle events near 2023~24 after an already substantial support cycle from 2007~08 to 2023~24. This span of time, roughly 17 years, is very likely to be a blend of the Unraveling & Crisis phases of the super-cycle. We believe the broader Crisis phase will continue to transition throughout a span of time lasting well into 2031~2034. This suggests we may have another 11 to 15+ years of a massive unwinding cycle throughout the globe.
SUPER-CYCLE RESEARCHER DATA FROM OUR RESEARCH TEAM
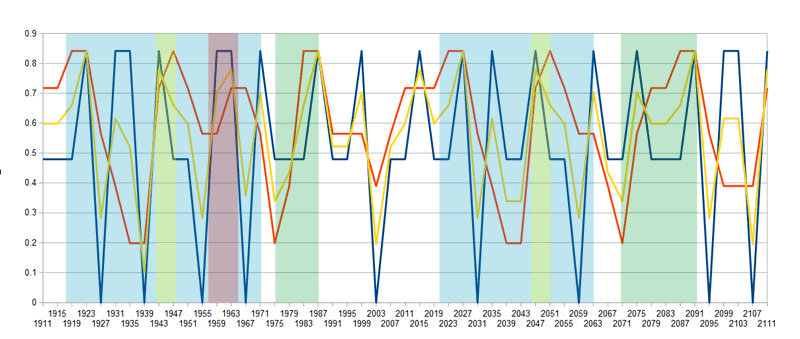
Our research team believes the COVID-19 virus event sent these super-cycles into Warp-Speed recently. The US stock market was poised to rally early in 2020 and may have experienced a multi-year rally had it not been for the COVID-19 disruption that took place in Mid-February. The destruction of the economy related to the COVID-19 shutdown is still playing out. Recent news suggests 41% of businesses that closed on Yelp have shut down permanently. Now, consider that this means for consumers and local governments related to earning and revenue capabilities? Workers have been fired and have completely lost earnings capabilities. Business owners now face credit/debt issues and possible bankruptcies. Local governments have lost revenue from taxes, payroll, sales, and fees and permits. This destructive cycle continues until the economy has shed the “excess” within all segments of core economic function.
MORE DATA & MORE PREDICTIONS
Within the first two segments of this article, we’ve highlighted numerous data points and charts to more clearly illustrate the current global market environment. We have to consider the reality of what is happening on the ground throughout the world and, in particular, what is happening in the US and most major economies right now. If 30 to 40%, or more, of local businesses, are closing permanently, this suggests that 30 to 50% of tax revenues for local governments will also vanish. It also suggests that these displaced workers and business owners will need to find new sources of income/revenue over the next 12+ months.
As much as we would like to think a “V-shaped” recovery is highly likely, it’s not going to happen is 30 to 50% of the US economy is suffering at levels being reported currently. Yes, you could have investors pile into the US stock market because they believe the US economy is the most likely to develop a strong recovery in the future, but that will likely happen after the excess has been processed out of the economy through a business/credit contraction phase. The current stock market valuation levels seem to ignore the fact that consumer and business activity has likely collapsed by a minimum of 25 to 45% (or more) over the past 90+ days – and may not recover to levels anywhere near the early 2020 economic activity levels.
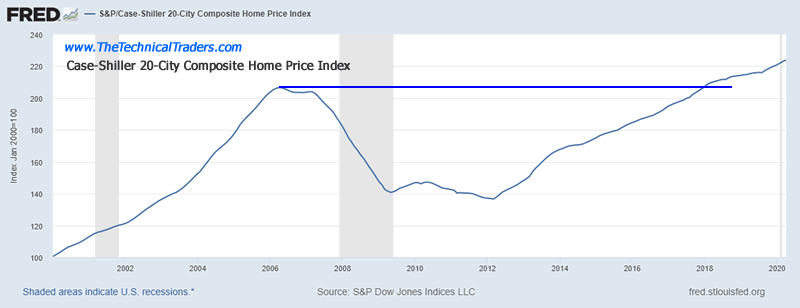
Still, if you listen to the news and watch the data related to the real estate market, you would think there has been no disruption in the US economy. Supposedly, homes are still selling quickly and the market is very robust. The Case-Shiller 20 city home price index is well above 220, the highest levels ever reached for this index. This suggests home prices have risen to levels that are likely 15% to 30% higher than the peak levels in 2006-2007 – yet we’ve just experienced a massive economic disruption across the globe where 25% to 45% (or more) of our economic earning and income capability has vanished. Read between the lines if you must – something doesn’t seem to be reporting valid data at the moment.
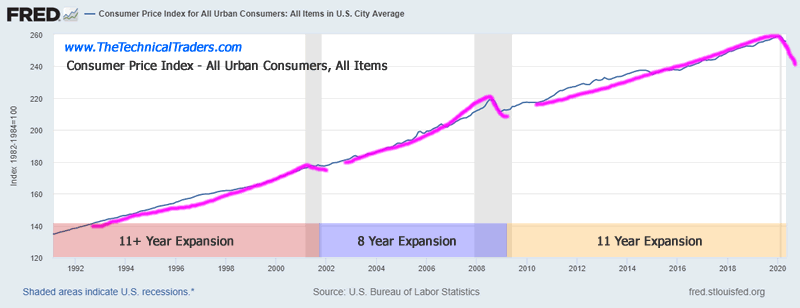
The Consumer Price Index has recently started falling. The only times in history where the CPI level has initiated substantial downward trends are throughout major recessionary or contraction economic phases. It is very likely that the decrease in the CPI level is reflecting a supply glut pricing effect as a result of the COVID-19 shutdown process. When consumer activity drops dramatically while supply channels continue as normal, a supply glut happens. When this happens, price levels must adjust and address the over-supply of goods and raw materials stacking up in warehouses, containers, and ships.
If the consumers earning and spending capabilities are disrupted long enough, the manufacturing and supply side of the equation can’t react fast enough to the immediate decline in demand. Therefore, the supply glut continues for a period of time as manufacturers attempt to scale-down the production levels to address for proper demand levels. Obviously, lower demand equates to lower sales volumes and lower-income levels for manufacturers and sales outlets. This translates into layoffs at the factories, sales outlets, and all levels in between. The cycle continues like this until an equilibrium is reached between supply and demand.
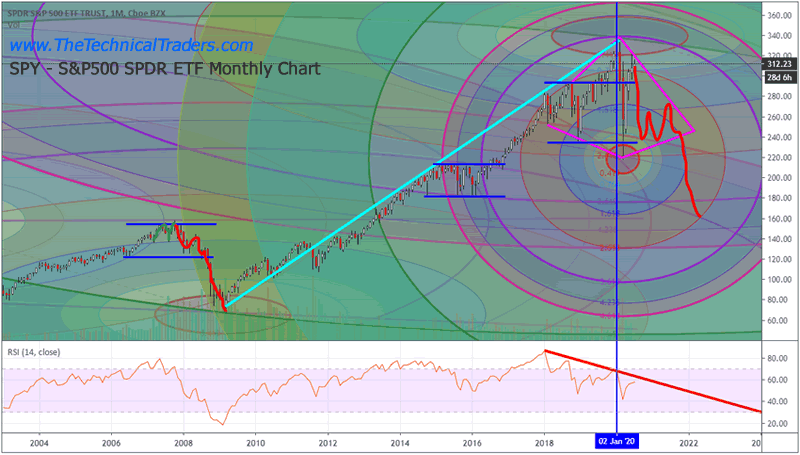
This translates into lower-earning expectations for much of the US and foreign markets compared to previous expectations. While the S&P 500 stock price levels have recovered to nearly the early 2020 price levels, it seems rather obvious to us that Q2 earnings data will likely shock the markets with dramatically lower results and forward expectations – in some cases these numbers may be disastrous.
When Nike released their Q4 (May 2020) earnings and showed a nearly $800 loss because of the early COVID-19 shutdown, this should have presented a very real understanding of how all levels of retail, manufacturing, and consumer services would also likely show a dramatic economic contraction taking place. Currently, we are watching for news of new US businesses entering the bankruptcy process. This recent article suggests business bankruptcies are skyrocketing higher – yet are still below the 2008~09 levels. Please keep in mind that we are only 90+ days into this COVID-19 virus event – so this data is still very early reporting.
Still, the numbers are very telling…
“US filings totaled 3,427 on June 24, according to data from Epiq seen by the Times. The reading also closes in on the financial-crisis reading of 3,491 companies entering bankruptcy in the first half of 2008. “
If you are reading the same data I read from that statement, the difference between the 2008 levels and current levels is only 64 additional bankruptcies in the US – less than a 2% difference in total bankruptcies.
The reality of the current market conditions is that we are only 90+ days into this processing of all this new data and attempting to understand what is likely to become a new operating norm for global economies. In 2008-09, the unwinding process took place over a full 12 to 16-month process. The recovery process too much longer – more than 5+ years. Currently, the unwinding process of the COVID-19 collapse took less than 30 days and the recovery process took a little over 90 days.
If our research team is correct, the speed at which the current recovery took place is nothing more than a reactionary recovery to a problem that was sudden and full of uncertainty. The Q2 data will likely solidify the uncertainty and unknowns into very real economic values (losses) and may shock the US stock market into a downward price reversion phase.
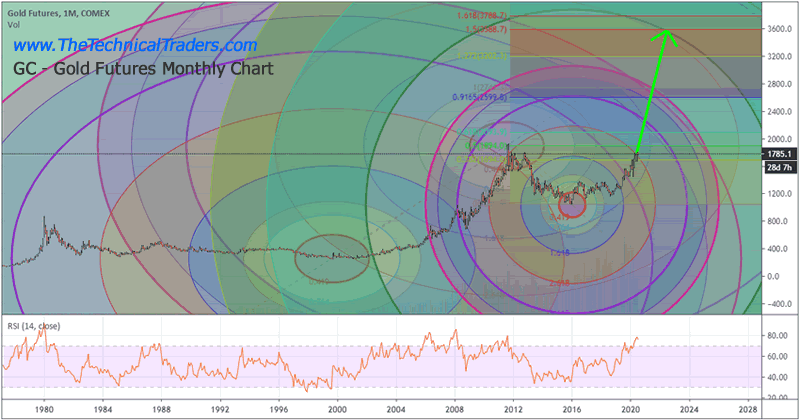
We believe one of the best hedging tools any skilled technical trader can use right now is Gold and Silver (Precious Metals). We continue to urge our friends and followers to maintain a portion of our portfolio in precious metals as a hedge against risk and unknowns throughout most of 2020 and beyond. If the Q2 data does what we believe it will do, shock the markets, then a moderately violent and volatile downside price move is pending. Simply put, you can’t destroy 25 to 45% of an active economy and displace millions of workers while sustaining high price valuations – unless you have a bubble-like euphoric investor mentality. That, ladies and gentlemen, is exactly what we believe is happening right now.
The super-cycle event that took place between 1920 and 1929 was nothing more than a euphoric bubble-like event where investors and traders had “no fear”. Everyone was leveraging everything they could to try to jump into the markets because they believed nothing could stop the rally. Keeping this in mind, you may want to read this recent research post about parabolic bubbles we published on June 23, 2020.
When bubbles burst, most commonly done when investors suddenly come to their senses in terms of real valuation expectations, the downside price moves can be extremely distressing. We urge you to properly understand that may happen with Q2 earnings data and new announcements. We also urge you to understand the COVID-19 virus event may have moved the super-cycles into some type of “warp-speed”. If our research is correct, we could be speeding towards a massive unwinding/crisis cycle phase very similar to 1929~1945.
Please read all the previous segments of this article and please properly position your portfolio to protect your assets. There will be lots of other trades in the future for all of us. These bigger price moves are not suddenly going to end because of Q2 or Q3 data. Be patient and stay protected. Q2 data is almost here and we are about to see some realization of the COVID-19 economic destruction process.
Get our Active ETF Swing Trade Signals or if you have any type of retirement account and are looking for signals when to own equities, bonds, or cash, be sure to become a member of my Passive Long-Term ETF Investing Signals which we are about to issue a new signal for subscribers.
Chris Vermeulen
www.TheTechnicalTraders.com
Chris Vermeulen has been involved in the markets since 1997 and is the founder of Technical Traders Ltd. He is an internationally recognized technical analyst, trader, and is the author of the book: 7 Steps to Win With Logic
Through years of research, trading and helping individual traders around the world. He learned that many traders have great trading ideas, but they lack one thing, they struggle to execute trades in a systematic way for consistent results. Chris helps educate traders with a three-hour video course that can change your trading results for the better.
His mission is to help his clients boost their trading performance while reducing market exposure and portfolio volatility.
He is a regular speaker on HoweStreet.com, and the FinancialSurvivorNetwork radio shows. Chris was also featured on the cover of AmalgaTrader Magazine, and contributes articles to several leading financial hubs like MarketOracle.co.uk
Disclaimer: Nothing in this report should be construed as a solicitation to buy or sell any securities mentioned. Technical Traders Ltd., its owners and the author of this report are not registered broker-dealers or financial advisors. Before investing in any securities, you should consult with your financial advisor and a registered broker-dealer. Never make an investment based solely on what you read in an online or printed report, including this report, especially if the investment involves a small, thinly-traded company that isn’t well known. Technical Traders Ltd. and the author of this report has been paid by Cardiff Energy Corp. In addition, the author owns shares of Cardiff Energy Corp. and would also benefit from volume and price appreciation of its stock. The information provided here within should not be construed as a financial analysis but rather as an advertisement. The author’s views and opinions regarding the companies featured in reports are his own views and are based on information that he has researched independently and has received, which the author assumes to be reliable. Technical Traders Ltd. and the author of this report do not guarantee the accuracy, completeness, or usefulness of any content of this report, nor its fitness for any particular purpose. Lastly, the author does not guarantee that any of the companies mentioned in the reports will perform as expected, and any comparisons made to other companies may not be valid or come into effect.
Chris Vermeulen Archive |
© 2005-2022 http://www.MarketOracle.co.uk - The Market Oracle is a FREE Daily Financial Markets Analysis & Forecasting online publication.