


Credit Market Investments Turned Into End-User Risk Again
Stock-Markets / Financial Markets 2020 Jul 13, 2020 - 01:05 PM GMTBy: Chris_Vermeulen

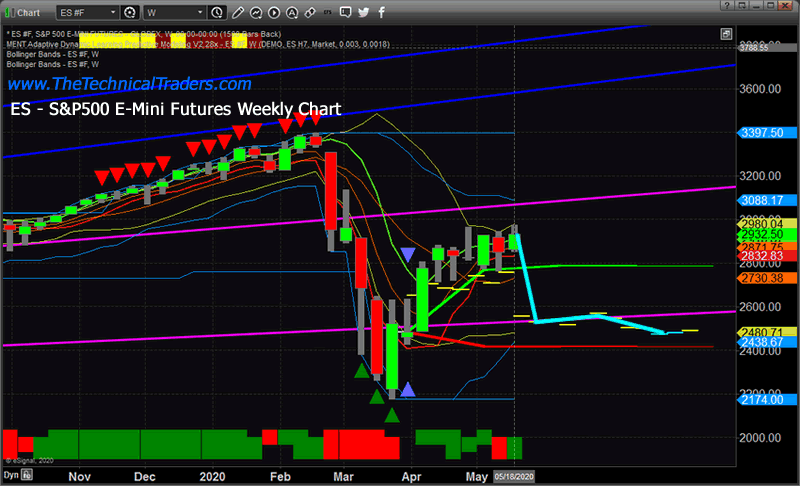
Continuing our research from Part I, into what to expect in Q2 and Q3 of 2020, we’ll start by discussing our Adaptive Dynamic Learning predictive modeling system and our belief that the US stock market is rallied beyond proper expectation levels. The Adaptive Dynamic Learning (ADL) modeling systems attempts to identify price and technical indicator DNA markers and attempts to map our these unique price setups. Then, it attempts to learn from the past DNA markers and apply that learned price behavior to future price DNA markers. In this manner, it learns from the past and applies that knowledge to the future.
ES ADL PREDICTIVE MODELING
On June 15, 2020, we published this article referencing the ADL predictive modeling system and how the US stock markets were, at that time, 12% to 15% overvalued based on this analysis. Continuing this research, our researchers still believe the ES (S&P500) is very likely to fall to levels near $2500 before finding support just below that level. These predicted ADL price levels strongly suggest that the true valuation levels for the ES are near $2500 – not near the overvalued levels closer to $3000.
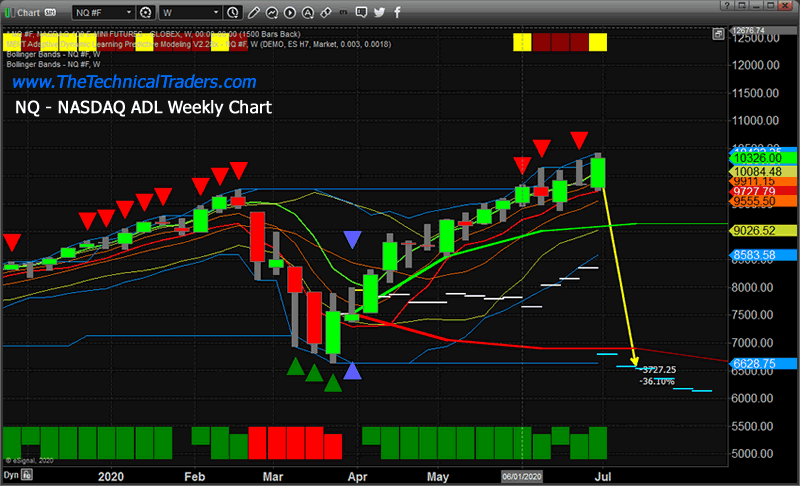
NQ ADL PREDICTIVE MODELING
Additionally, an update NQ ADL Weekly chart suggests the NQ has rallied to levels that appear to be extremely overvalued. The current ADL prediction levels suggest the NQ ADL valuation levels should be near $6600 – not near $10,325 as they are now. This suggests a massive -36% price disparity between the current overvalued rally level of the NQ and the expected ADL price level based on our advanced predictive modeling system.
Now that we’ve attempted to explain one of the core elements of our research estimates, let’s get further into the data that is likely to present a very real opportunity for skilled technical traders.
ECONOMIC CYCLES
As you are likely well aware of by now, a series of catastrophic economic events continue to unfold throughout the globe. Most importantly, the ability to earn revenues for consumers and corporations while dealing with hard fixed costs. In previous articles, we’ve suggested our belief that a unique event in localized economies is not much of a concern because global central banks can support the market well enough to allow economic activity to resume near fairly normal levels. We’ve suggested that the bigger problem is when an extended economic contraction takes place that is a global or more wide-spread economic event. This type of economic crisis is much more dangerous because of two factors:
_ A. The continued lack of revenue generation increases the pressure on the individual or corporation to cut costs, employees, or other assets. Without the ability to earn, these individuals or corporations begin to eat up cash reserves very quickly and will quickly begin to identify their longer-term sustainability objectives. Unless the economy starts to recover quickly, this crisis for the individual or corporation could be a moderately slow and dangerous “bleed-out” event leading to bankruptcy.
_B. The efforts of localized governments and global banking institutions initially attempt to mitigate the risks of such an event. This is usually done by providing greater capital resources to certain industries, the general banking system, and in other ways/sources. Currently, within the US, a number of forbearance programs have been initiated to take away certain pressures for homeowners and others. Still, the economy must continue to operate within normal boundaries and bills must be paid. With an extended economic collapse, such as we may be experiencing with the COVID-19 virus event, the problems for consumers and corporations grow bigger and more dangerous the longer the economic contraction event continues.
When you really start to understand the cycle of these events and then begin to understand the domino-effect process that may already be playing out in some form, skilled technical investors should already be preparing for extended price volatility and unknowns over the next 6+ months or longer. Allow us to explain, in simple terms, how this cycle plays out…
_ Local consumers/workers are laid-off or fired from jobs. This puts immediate earnings pressure on local families and individuals and it pushes them into a protective mode where they suddenly must decide between essential items (food, medicine, personal care, transportation, and other essentials) vs. non-essential items (movies, dining out, travel, discretionary purchases, and others). Currently, there are more than 35 million unemployed people in the US (roughly 10% of the total population.
_ The COVID-19 shutdown within the US has disrupted the earning capabilities of many businesses over the past 3+ months. As consumers slow down their purchases and businesses close because of government shutdown orders, the problems amplify for many business owners and employees. If you have ever owned your own business, you understand the risks involved and the ongoing hard costs associated with owning a business. Just because the governor orders a “shutdown” doesn’t mean that your hard monthly costs are going away too. This ongoing problem sets up another crisis event in the making – the Business Owner risk factor. How long before these individual business owners simply can’t sustain their operations any longer and are forced into bankruptcy?
_ Local governments derive their operating budgets from taxes and revenues generated within their communities. With the COVID-19 shutdown crippling these revenues, we estimate that Q3 and Q4 2020 will become a point of “bleed-out” for many local governments. They may be able to manage their budgets for a few months within the economic contraction period, but we believe the longer this economic contraction event continues, more and more pressure will be put on local and regional (city/state) governments where revenues have likely collapsed 25% to 45%+ recently.
_ The bigger cycle start to take place. (A) With consumers laid-off and/or fired from their jobs, their income levels drop dramatically and their spending decreases dramatically. (B) With business owners struggling to survive with hard costs and payroll in a depressed economic environment, these businesses will either find a way to survive or fail – laying off more people and creating further disruption in earnings/revenues for workers and local governments. (C) With local governments slow to react to the economic contraction (and mostly hiring under contract), the decreases in revenue over time may present a very real issue for government agencies and become a real problem 4 to 6+ months into the economic contraction.
_ When businesses and governments suddenly realize the scale and scope of the economic contraction, they will attempt to balance their books by adapting (developing new sources of revenue: products, services, taxes, fees) and/or begin to contract themselves. Either of these two options is fraught with risk and could potentially increase the risks of a more extended economic contraction event. Raising taxes or fees on consumers/businesses within a massive economic contraction event will likely push more individuals/businesses into bankruptcy – further decreasing the government revenues. Developing new products/services and marketing them to consumers requires capital and resources. If the product is not a success, the business takes a huge risk making these aggressive transitional moves – which may lead to increased economic concerns. As long as the consumer is struggling and not earning sufficiently, the foundation of the economic structure is at risk of collapsing even further.
This cycle is sometimes called the “death cycle” in economic terms. It is a cycle where economic contraction leads to further economic contraction. The process of breaking this cycle is simple, the entire economic engine must “unwind” sufficiently to remove/reduce the overextended valuation and “fluff” within the system. Once this has happened, then a new economic foundation will begin to establish where growth and opportunity will resume within local and regional economies.
IMPORTANT ECONOMIC DATA
Now, let’s look at some of the data that supports our research.
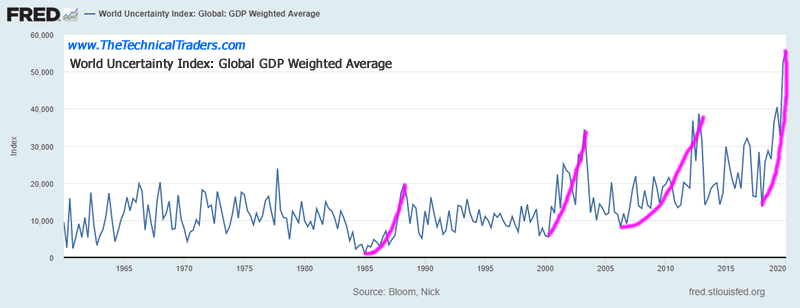
The World Uncertainty Index has recently skyrocketed above 50, the highest level over the past 60+ years. Since the low point, in 1985, the World Uncertainty Index has continued to rise with higher peaks and higher troughs over the past 30+ years. Currently, this index suggests there is a massive amount of uncertainty throughout the globe related to economic function, central banks, geopolitical issues, and humanitarian issues.
Bay very close attention to the peaks in this index and the dates of these peaks (2004, 2013, 2020). The 2004 and 2013 peaks occurred roughly 3 to 4 years after a major stock market bottom setup. The current index high would suggest a market bottom may have set up in 2016 and a peak in this Uncertainty index may still be 12 to 24 months away. This suggests we may still experience a moderately high degree of uncertainty and a number of unknown global and economic crisis events over the next 12 to 24 months.
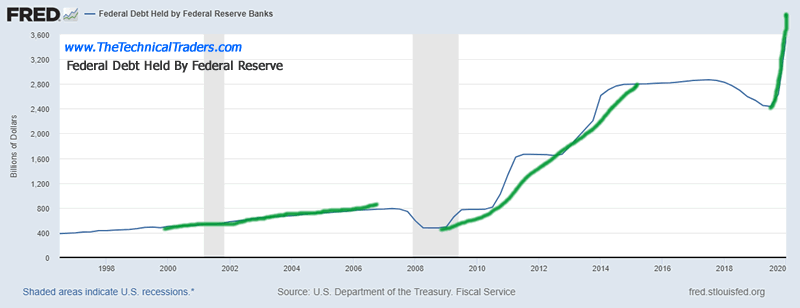
The US Federal Reserve has recently begun another massive quantitative easing phase and actively begun to purchase various forms of debt, bonds, and equity within the financial markets. Paying attention to the rallies in the Fed buying activity and the World Uncertainty Index, you’ll see the peaks in the Uncertainty index align with the midpoints of the Fed activities. Generally, the uncertainty levels rise as the US Fed intervenes and executes QE policies to support the global markets.
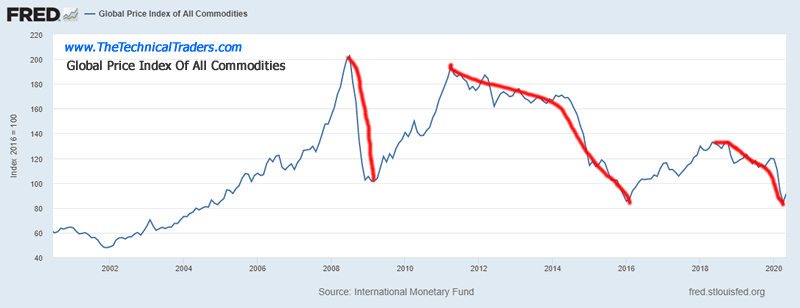
This Global Commodity Price Index chart highlights the recent collapse in raw commodity prices and illustrates the incredibly depressed level of commodities related to global economic activities. Over the past 20 years, the only time when commodity prices were lower was in early 2000~2005 – just after the 9/11 economic contraction. The current Commodity Price Index level suggests we have entered a new deflationary price cycle with the peak setup near August/September 2018 – just before the big downside price contraction started in October 2018. Our researchers have continued to highlight that point on multiple charts as the true peak in the US and global markets
At this point in time, developing a safe and protected strategy to ride out these uncertain times is essential. We’ve been advising our clients to stay safely away from the global stock market trends and we issued a Black Swan warning on February 21, 2020, telling all of our clients to “get into cash immediately”. Since then, we’ve advised our clients to move their capital into selected sectors to take advantage of hedging opportunities and targeted trading opportunities over the past 3+ months.
We continue to believe the best way to profit from these market trends is to develop a super conservative investment model where Cash is King and proper hedging is essential. There are plenty of great trades to select from – assuming we want to take on the additional risks associated with these trades.
We believe the next 3+ months will result in a massive volatility spike, likely seeing the VIX move above 50~60 again, as Q2and Q3 earnings and expectations continue to shock the investment community. We do not believe this potential “V-Shaped” recovery is sustainable and continues to advise our clients to be prepared downside price reversion.
Get our Active ETF Swing Trade Signals or if you have any type of retirement account and are looking for signals when to own equities, bonds, or cash, be sure to become a member of my Passive Long-Term ETF Investing Signals which we are about to issue a new signal for subscribers.
Chris Vermeulen
www.TheTechnicalTraders.com
Chris Vermeulen has been involved in the markets since 1997 and is the founder of Technical Traders Ltd. He is an internationally recognized technical analyst, trader, and is the author of the book: 7 Steps to Win With Logic
Through years of research, trading and helping individual traders around the world. He learned that many traders have great trading ideas, but they lack one thing, they struggle to execute trades in a systematic way for consistent results. Chris helps educate traders with a three-hour video course that can change your trading results for the better.
His mission is to help his clients boost their trading performance while reducing market exposure and portfolio volatility.
He is a regular speaker on HoweStreet.com, and the FinancialSurvivorNetwork radio shows. Chris was also featured on the cover of AmalgaTrader Magazine, and contributes articles to several leading financial hubs like MarketOracle.co.uk
Disclaimer: Nothing in this report should be construed as a solicitation to buy or sell any securities mentioned. Technical Traders Ltd., its owners and the author of this report are not registered broker-dealers or financial advisors. Before investing in any securities, you should consult with your financial advisor and a registered broker-dealer. Never make an investment based solely on what you read in an online or printed report, including this report, especially if the investment involves a small, thinly-traded company that isn’t well known. Technical Traders Ltd. and the author of this report has been paid by Cardiff Energy Corp. In addition, the author owns shares of Cardiff Energy Corp. and would also benefit from volume and price appreciation of its stock. The information provided here within should not be construed as a financial analysis but rather as an advertisement. The author’s views and opinions regarding the companies featured in reports are his own views and are based on information that he has researched independently and has received, which the author assumes to be reliable. Technical Traders Ltd. and the author of this report do not guarantee the accuracy, completeness, or usefulness of any content of this report, nor its fitness for any particular purpose. Lastly, the author does not guarantee that any of the companies mentioned in the reports will perform as expected, and any comparisons made to other companies may not be valid or come into effect.
Chris Vermeulen Archive |
© 2005-2022 http://www.MarketOracle.co.uk - The Market Oracle is a FREE Daily Financial Markets Analysis & Forecasting online publication.