


More Stock Market Selling Ahead
Stock-Markets / Stock Markets 2020 Jun 30, 2020 - 02:15 PM GMTBy: Andre_Gratian

Current Position of the Market
SPX: Long-term trend – Having rallied well past a .618 retracement of the decline into March 2020, it is time to consider the possibility that the retracement was only an interruption of the bull market which originated in 2009.
Intermediate trend – Down into mid-July
Analysis of the short-term trend is done daily with the help of hourly charts. It is an important adjunct to the analysis of daily and weekly charts which discusses the course of longer market trends.
Daily market analysis of the short-term trend is reserved for subscribers. If you would like to sign up for a FREE 4-week trial period of daily comments, please go to www.marketurningpoints.com and request a trial.
More Selling Ahead
Important Cycle lows
26-d cycle due 6/27 – 52-d cycle due 7/6 – 40-wk cycle due 7/20
Market Analysis (Charts courtesy of QChart)
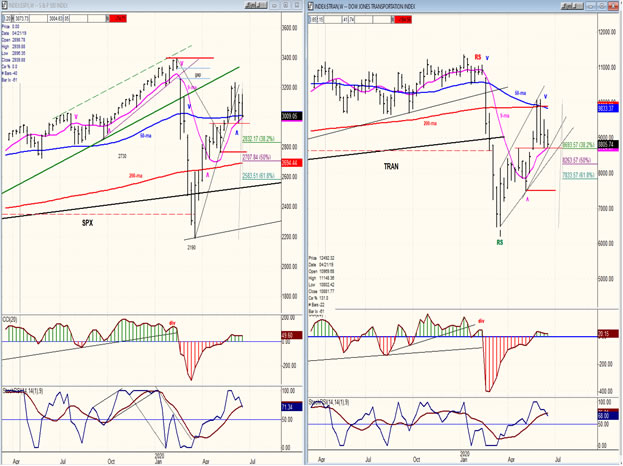
SPX-TRAN weekly charts
Last week was a down week for SPX and TRAN with both aiming at a support level which has already been reached by the latter. With some cycle lows still ahead, Fibonacci retracements which correspond to P&F projections are likely to be reached. These are given on the charts. TRAN has already retraced .382 of its recent uptrend and should go to 50% as SPX drops down to its first projection level.
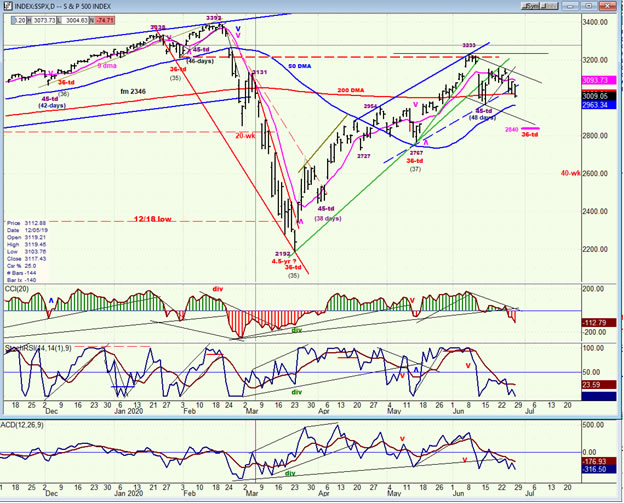
SPX daily chart
After holding one day at the 200-dma, SPX has resumed its decline toward the estimated 2850 projection level which could/should coincide with Fibonacci retracements. The oscillators, which are negative and dropping, support the view that the decline is still in full swing over the short-term; and the index is currently pulled down by the 52-day cycle (36-td) which is due to bottom in the first week of July.
There could be a day or two of holding around the 200-dma caused by the 26-day cycle mid-phase which is due to make its low over the weekend.
The 40-wk cycle bottoms a couple of weeks after the first cycle and creates the potential for expanding the decline beyond the first projection. This is also suggested by P&F and Fibonacci. Whether or not this is realized will depend on the holding power of the first cycle.
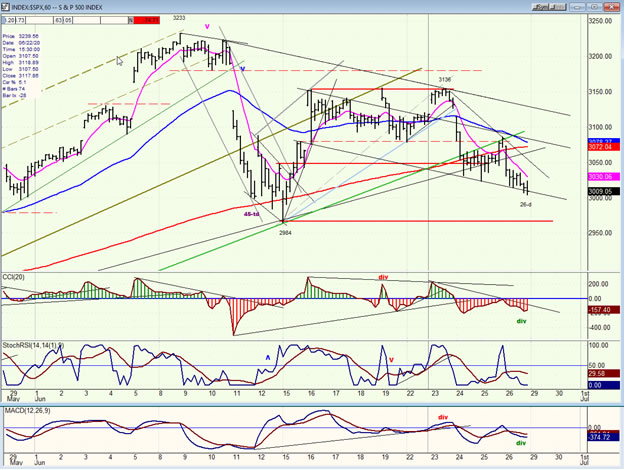
SPX hourly chart
The first phase of the correction started at 3233 and brought an unusually severe 249-point decline down to 2984 -- most of it in one day! A one-day countertrend rally took the index back to 3153 where it started to form a congestion top which took 6 trading days to complete. Last Tuesday, the second phase of the decline started and continued into Friday. Prices have remained above 2984 so far, but perhaps after a brief bounce, they should continue lower into the 52-day low due on about 7/6. There is some mild positive divergence in a couple of the hourly indicators which suggest a potential brief hold before the completion of the second phase of the correction in the vicinity of the 2834 level (.382 retracement) -- unless this projection is reserved for the next cycle low.
An even larger 40-wk cycle low is due ideally two weeks later which could continue the decline to an even lower projection. This possibility will have to be decided after we have evaluated the market action after the first target is reached.
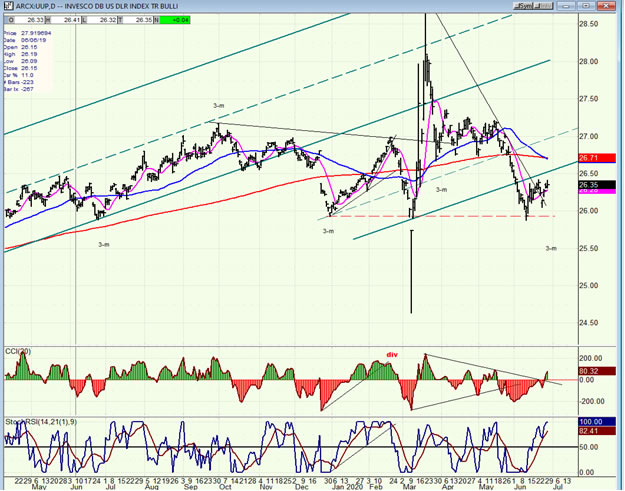
UUP (dollar ETF) daily
UUP continues to hold above a former support level, but unless the 3-mo cycle has already made its low, it should have one more decline, perhaps to close the gap at ~ 25.80.
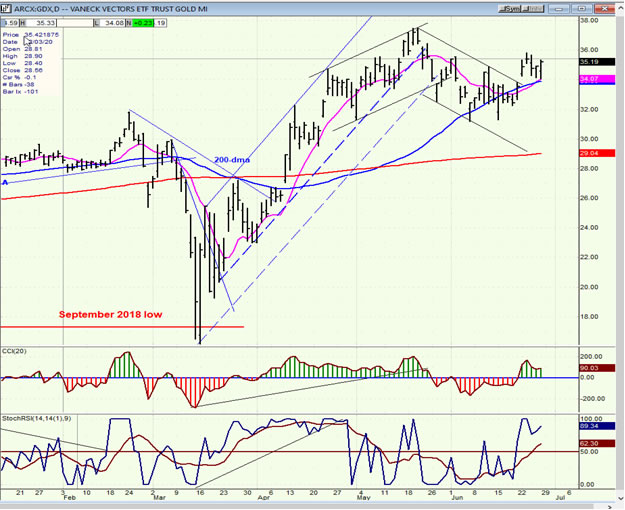
GDX (Gold miners ETF) daily
It is unclear if GDX is ready to extend its uptrend right away, or if it requires a little more consolidation first. In either case, this move represents a break out of a significant base which will eventually bring much higher prices.
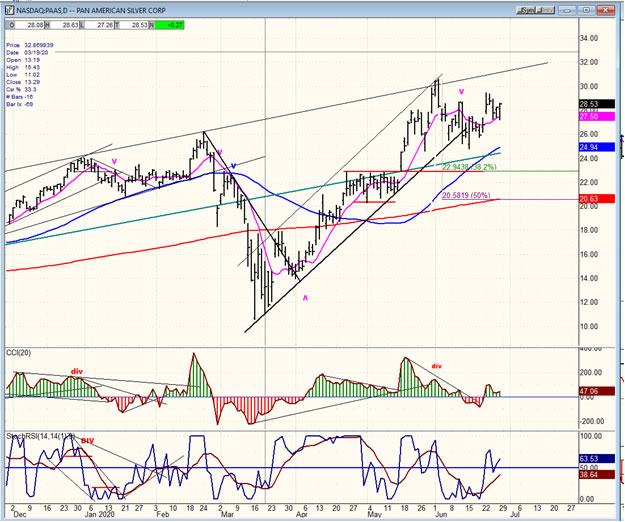
PAAS (Pan American Silver Corp.) daily
The action of PAAS over the next few days will clarify that of GDX. If PAAS is unable to extend its move right away, it is most likely making a flat consolidation which will require a few more days on the downside before moving to a new high.
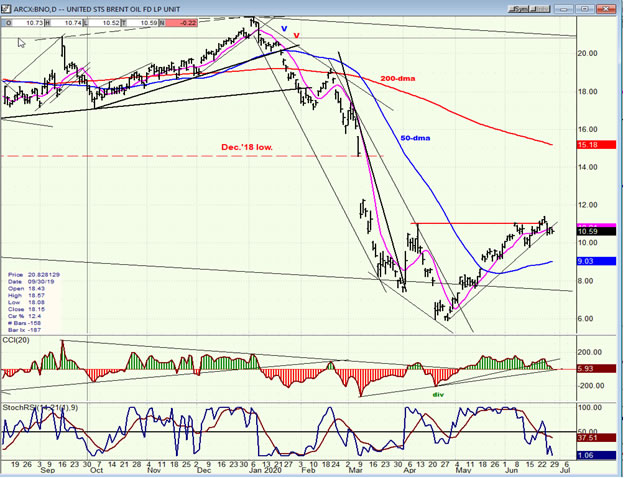
BNO (U.S. Brent oil fund) daily
BNO has started a correction which could retrace its recent move at least down to the level of its (blue) 50-dma.
Summary
SPX has started the next phase of its correction which should take it below its recent low of 2965 right away. A retracement at least to the 2850 level is expected but it is unclear if it will come at the end of the first week in July, or in the third week.
Andre
FREE TRIAL SUBSCRIPTON
For a FREE 4-week trial, send an email to anvi1962@cableone.net, or go to www.marketurningpoints.com and click on "subscribe". There, you will also find subscription options, payment plans, weekly newsletters, and general information. By clicking on "Free Newsletter" you can get a preview of the latest newsletter which is normally posted on Sunday afternoon (unless it happens to be a 3-day weekend, in which case it could be posted on Monday).
Disclaimer - The above comments about the financial markets are based purely on what I consider to be sound technical analysis principles uncompromised by fundamental considerations. They represent my own opinion and are not meant to be construed as trading or investment advice, but are offered as an analytical point of view which might be of interest to those who follow stock market cycles and technical analysis.
Andre Gratian Archive |
© 2005-2022 http://www.MarketOracle.co.uk - The Market Oracle is a FREE Daily Financial Markets Analysis & Forecasting online publication.