


Crude Oil Price Meets Key Resistance
Commodities / Crude Oil Jun 27, 2020 - 06:42 PM GMTBy: Nadia_Simmons

Crude oil moved above the previous highs and at the moment of writing these words, it’s testing the upper border of the March price gap. And given the fundamental news that are reaching (and likely to reach) the market – the increasing Covid-19 cases in the U.S. and globally – it seems that black gold might not have enough strength to keep pushing higher.
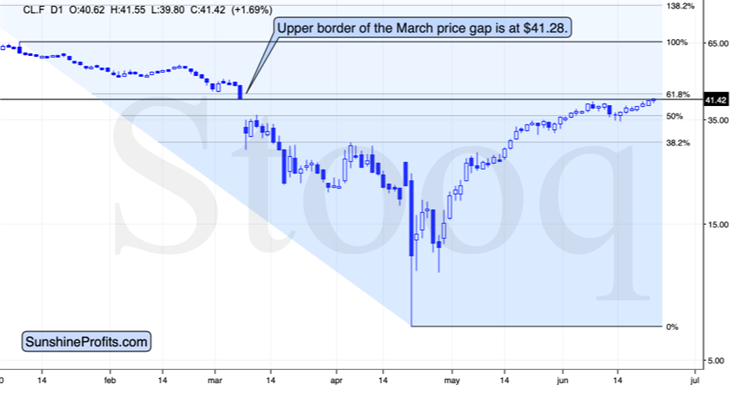
The upper border of the March price gap is one of the most important resistance levels nearby. There’s also the 61.8% Fibonacci retracement level, but since it’s based on the April low that is relatively unclear (different series of futures contracts were trading at very different price levels, some were even in the negative territory), the Fibonacci retracement might not be as reliable as the price gap.
This means that the resistance level that is being tested right now, is of critical importance. Please note how aligned is the price of crude oil with the previous spending chart – and with the prices of stocks themselves.
Just several months ago, crude oil was one of the weakest markets out there, and its rebound was one of the strongest. The reversal in black gold and a decisive decline could be the thing that tips the scale for all markets.
Consequently, while a trigger is not necessary for the market to move in a given direction, getting one could speed things up. And it seems that crude oil’s reversal could be the trigger, along with a comeback of the USD Index.
When based on the daily closing prices, the resistance created by the upper border of the March price gap is at $41.28, and at the moment of writing these words, crude oil is trading 14 cents above this level. This by no means implies that the resistance is broken. If we see a daily close above $41.28, it could have bullish implications, but it doesn’t have them right now.
“Could”, because if we look at crude oil’s 4-hour chart, we’ll get a slightly different picture.
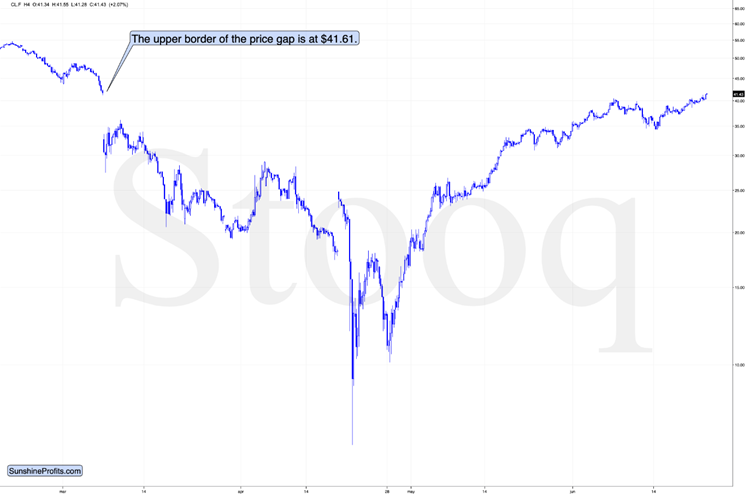
In this case, the upper border of the huge March price gap is at $41.61, which means that crude oil is actually slightly below it, not above it. The intraday high (so far) was $41.55, which means that this resistance was not touched on an intraday basis.
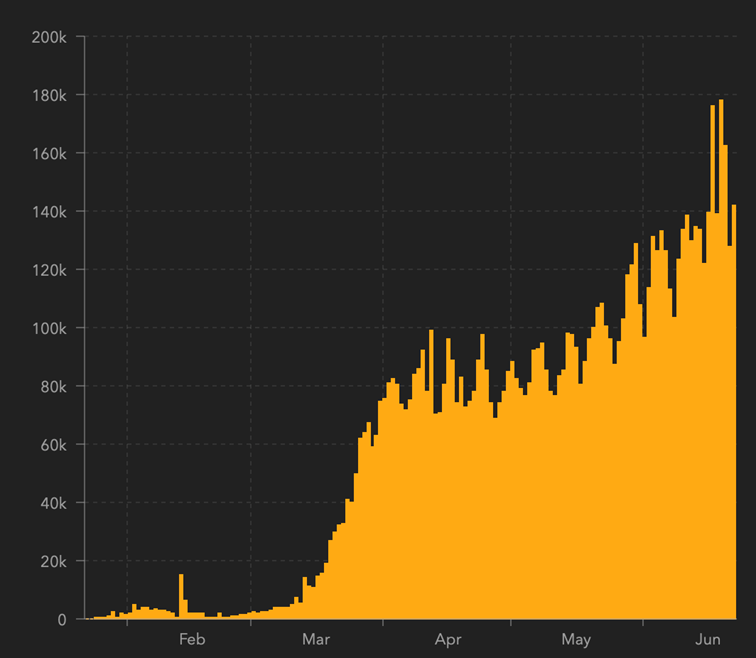
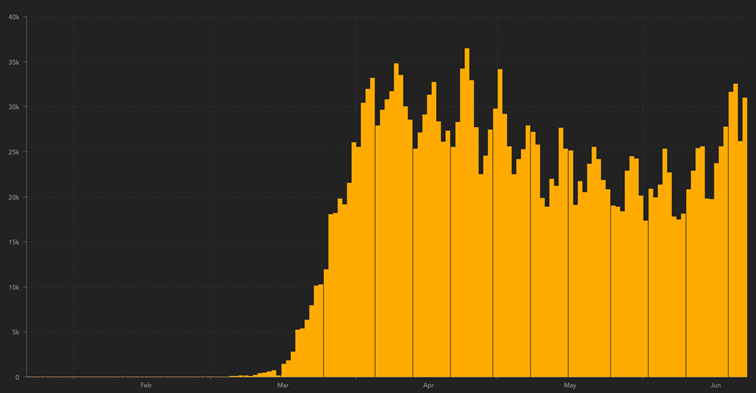
The first chart shows the new daily global cases and the second chart shows the new daily U.S. coronavirus cases. While it’s been obvious that the cases are in a steady uptrend globally, the upsurge in the U.S. cases and the second wave of the virus is a relatively new development and it’s not yet widely covered by the mass media. It’s not hidden, but it’s not being emphasized as much smaller numbers were emphasized in March. But it’s going to change once the new daily cases move to new highs as that’s a highly catchy topic and people won’t be able to ignore it.
Will crude oil be able to continue to show strength and rally further, even though it plunged on similar news in March? We view the former as unlikely.
If you enjoyed the above analysis and would like to receive free follow-ups, we encourage you to sign up for our daily newsletter – it’s free and if you don’t like it, you can unsubscribe with just 2 clicks. If you sign up today, you’ll also get 7 days of free access to our premium daily Oil Trading Alerts as well as Gold & Silver Trading Alerts. Sign up now.
Nadia Simmons
Forex & Oil Trading Strategist
Przemyslaw Radomski
Founder, Editor-in-chief
Sunshine Profits: Gold & Silver, Forex, Bitcoin, Crude Oil & Stocks
Stay updated: sign up for our free mailing list today
* * * * *
Disclaimer
All essays, research and information found above represent analyses and opinions of Nadia Simmons and Sunshine Profits' associates only. As such, it may prove wrong and be a subject to change without notice. Opinions and analyses were based on data available to authors of respective essays at the time of writing. Although the information provided above is based on careful research and sources that are believed to be accurate, Nadia Simmons and his associates do not guarantee the accuracy or thoroughness of the data or information reported. The opinions published above are neither an offer nor a recommendation to purchase or sell any securities. Nadia Simmons is not a Registered Securities Advisor. By reading Nadia Simmons’ reports you fully agree that he will not be held responsible or liable for any decisions you make regarding any information provided in these reports. Investing, trading and speculation in any financial markets may involve high risk of loss. Nadia Simmons, Sunshine Profits' employees and affiliates as well as members of their families may have a short or long position in any securities, including those mentioned in any of the reports or essays, and may make additional purchases and/or sales of those securities without notice.
© 2005-2022 http://www.MarketOracle.co.uk - The Market Oracle is a FREE Daily Financial Markets Analysis & Forecasting online publication.