


Stock Market Short-term Top?
Stock-Markets / Stock Markets 2020 Jun 03, 2020 - 12:08 PM GMTBy: Andre_Gratian

SPX: Long-term trend – We are in an official bear market
Intermediate trend – Concluding initial rally in a downtrend.
Analysis of the short-term trend is done daily with the help of hourly charts. It is an important adjunct to the analysis of daily and weekly charts which discusses the course of longer market trends.
Daily market analysis of the short-term trend is reserved for subscribers. If you would like to sign up for a FREE 4-week trial period of daily comments, please go to www.marketurningpoints.com and request a trial.
A Short-term Top?
Important Cycles
The downward pressure of the 45-td cycle (80-cal.days) was minimized by the 36-td cycle (52-cal.days) which made its low on 5/14; but, unless it is inverting, it should have enough left to bring the market down into the end of the week.
Point & Figure Overview of SPX
Re-accumulation at the 3010 level could take the index to about 3070.
Market Analysis (Charts courtesy of QChart)
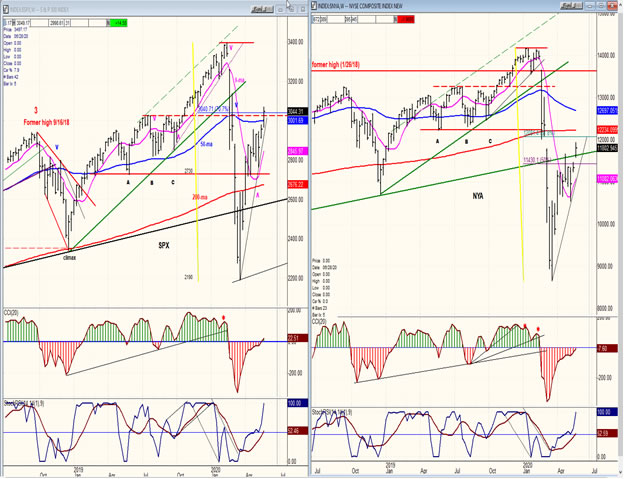
SPX-NYA weekly charts
The disparity of relative strength to the SPX is not confined to IWM. This week, I am posting NYA vs. SPX to show that NYA (the broadest index), is just as much of a laggard as IWM. The reason for this is that the large tech stocks have led the recovery from the March low by a wide margin. These stocks are also included in SPX and are contributing to its relative strength. Consequently, it is somewhat misleading to look at SPX (and better yet, NDX) as representative of the stock market recovery.
To-date, SPX has retraced a little more than 71% of its decline while NYA has fallen short of 62%.
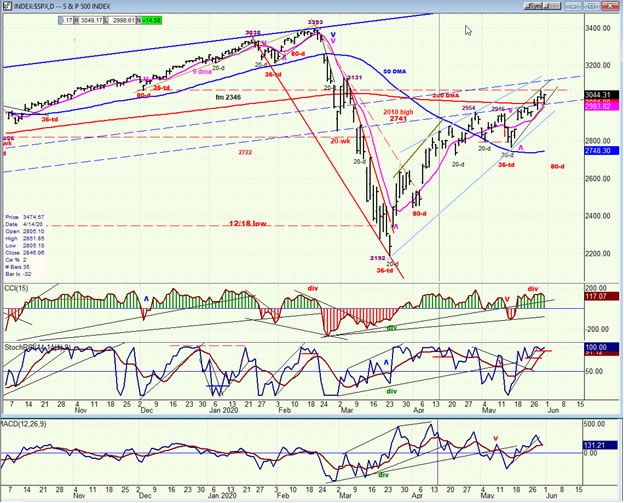
SPX daily chart
The blue trend lines are converging and making a wedge pattern, indicating that since mid-April SPX has been decelerating. However, after a two and a half-week correction into the 36-td low, it managed to make a new high which may just now be in the process of making a short-term top. The smaller pattern which emerged from that correction is itself making a wedge pattern; so, unless a strong price extension takes place in the next day or two, a reversal is likely into the low of the 45-day cycle due at the end of the week.
The 200-dma has been slightly surpassed, but the MA is only a loose gauge of the market trend. Trend lines and support and resistance levels are not necessarily exact either, although they are regularly observed by traders which gives them more legitimacy. Of all technical tools, I find that P&F charts are among the most beneficial. Although counts are not always exact, verifying them with oscillators such as SRSI, CCI and others enables us to arrive at much more accurate predictions.
The congestion that formed at the ~2500 base level calls for a minimum move to 3160 which could be achieved right away, buts has a better chance of occurring after the 45-day cycle has made its low.
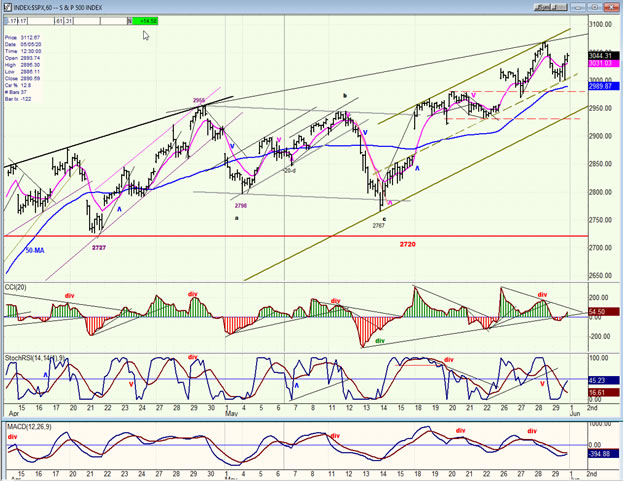
SPX hourly chart
I am looking for SPX to complete the move from 2767 and form a short-term top in the vicinity of 3070 before retracing into the end of the week or early the following week. There are many signs that this top
could occur as early as Monday unless the market opens with exceptional strength.
The move from 2767 started sluggishly after an a-b-c consolidation, but quickly overcame the former high and continued in a minor channel until negative divergence developed in the CCI. This brought a correction into the mid-channel line which acted as support, and where another small base quickly formed. Closing strength on Friday allowed the index to move out of its base to challenge the former minor high. This could simply be a test of that high or a final move to about 3070-75 before rolling over and starting a decline. Anything which substantially exceeds these boundaries would indicate that the short-term analysis is flawed and that a new perspective is needed; perhaps that the 45-day cycle has inverted.
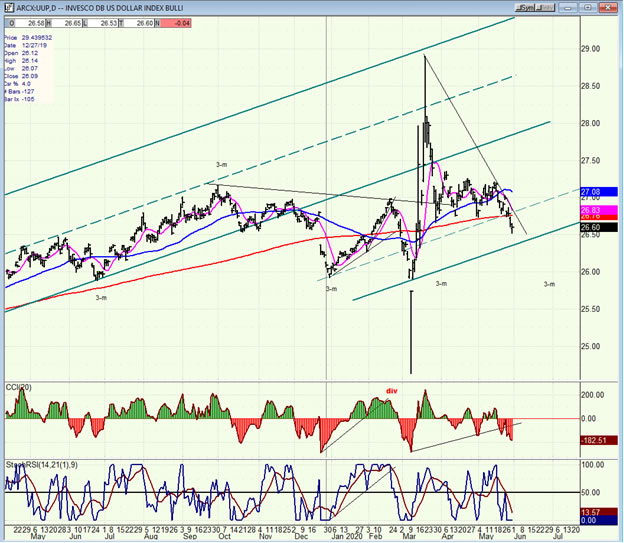
UUP (dollar ETF) daily
Last week, I mentioned that UUP was completing a narrow 3-phase consolidation above 27.00 and could be ready to succumb to downward pressure from the bottoming 3mo cycle. This is what is starting to happen with probably more to go until the end of June.
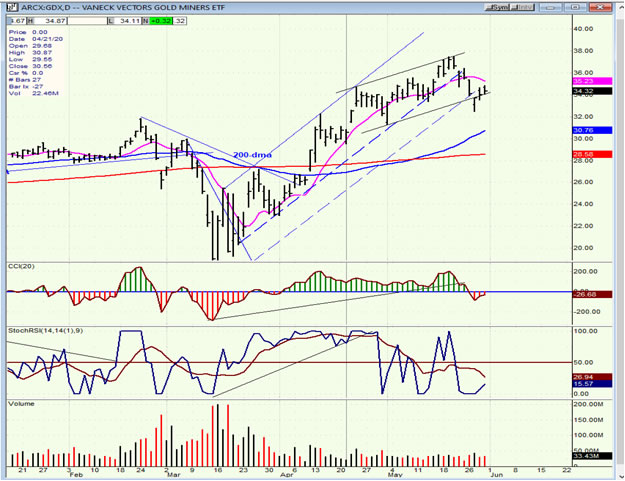
GDX (Gold miners ETF) daily
GDX is nearing the end of its run from the March lows. Some minor consolidation could be followed by a move to 39.00-39.50 before a corrective phase begins.
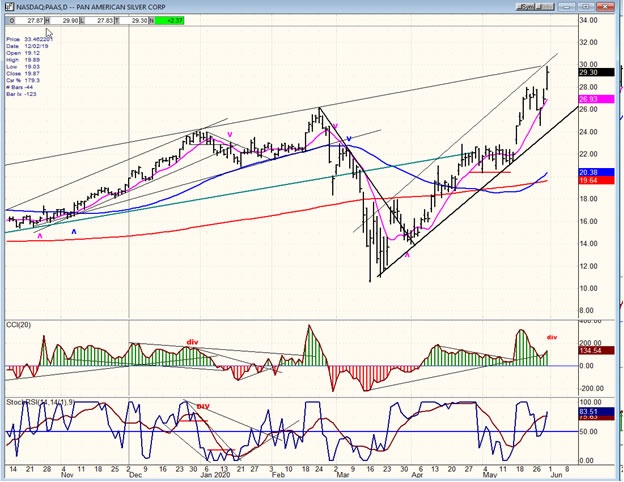
PAAS (Pan American Silver Corp.) daily
After following GDX since the March lows, PAAS is jumping ahead as it reaches for its own projection of 30-32.
BNO (U.S. Brent oil fund) daily
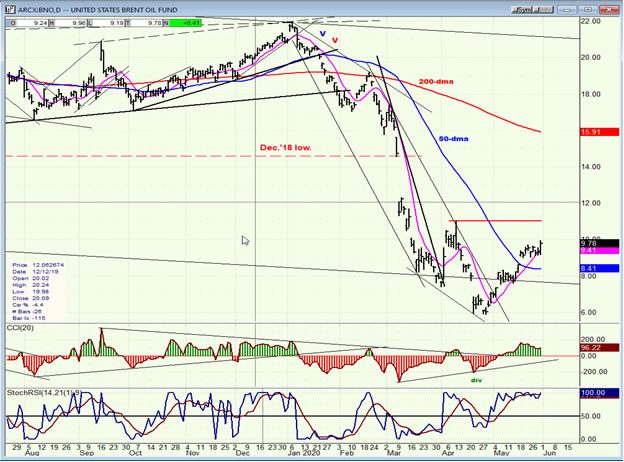
BNO was driven by the market to push fractionally higher and is waiting for the index to dictate its next short-term reversal.
Summary
As a result of the pressure coming from a combination of cycles, as well as the compelling need to fill the projection target established after the March low, SPX has continued to drive towards its intermediate destination (which could be at least 2160) before the 40-wk cycle forces a severe retracement into mid-July. However, ahead of this final high, one more short-term correction should take place as the 45-day cycle makes its low.Andre
FREE TRIAL SUBSCRIPTON
For a FREE 4-week trial, send an email to anvi1962@cableone.net, or go to www.marketurningpoints.com and click on "subscribe". There, you will also find subscription options, payment plans, weekly newsletters, and general information. By clicking on "Free Newsletter" you can get a preview of the latest newsletter which is normally posted on Sunday afternoon (unless it happens to be a 3-day weekend, in which case it could be posted on Monday).
Disclaimer - The above comments about the financial markets are based purely on what I consider to be sound technical analysis principles uncompromised by fundamental considerations. They represent my own opinion and are not meant to be construed as trading or investment advice, but are offered as an analytical point of view which might be of interest to those who follow stock market cycles and technical analysis.
Andre Gratian Archive |
© 2005-2022 http://www.MarketOracle.co.uk - The Market Oracle is a FREE Daily Financial Markets Analysis & Forecasting online publication.