


Forecasting Crude Oil: This Method Has Been the Undefeated Champion Since 1998
Commodities / Crude Oil May 10, 2020 - 04:43 PM GMTBy: EWI
 The battle between Elliott waves and supply/demand forecasting approach continues
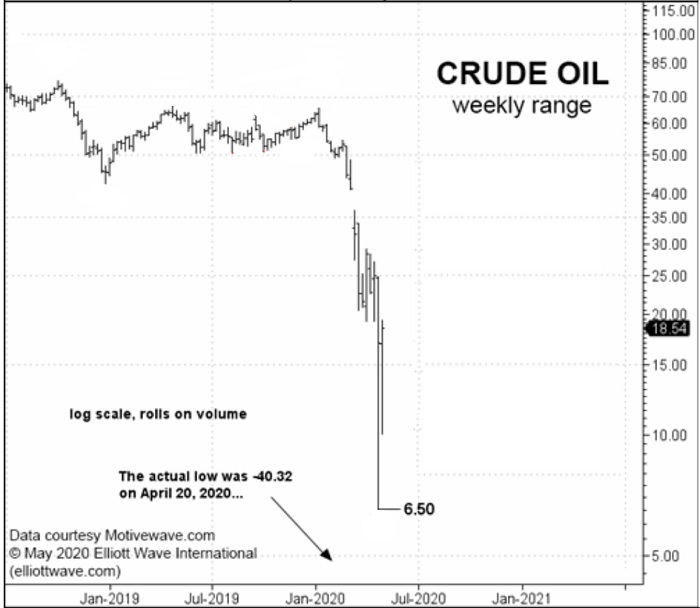
In case you just landed on Earth via Martian spaceship, 2020 has seen the biggest crash in oil prices ever.
This chart captures crude's three-month, 80%-plus nosedive to 3-decade lows. (Price data as of May 1, 2020 and does not reflect the unprecedented April 20 plunge into negative territory at -$40.32. Yes, minus $40.32).
Ask any economist with a few post-nominal letters what caused oil's crash, and they wouldn't think twice about the answer; namely, the largest supply surplus in modern history caused by the coronavirus-travel bans and subsequent contraction in fuel requirements. Says these headlines:
- "Crude Oil Prices Slammed Again on Supply Glut" (April 22 Daily FX)
- "Nowhere to Go: US oil prices fall back below zero as traders face supply glut." (Apr. 21 aljazeera.com)
- "Oil Sides with Rising Glut Spooking Investors" (Apr. 27 Wall Street Journal)
As a March 12 CNN Business surmised: "It's a nightmare scenario for the oil market."
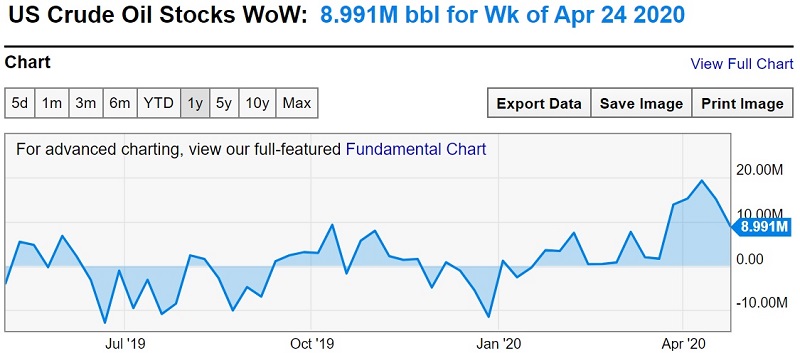
Indeed, the news events pertaining to crude oil and the global economy are nightmarish. However, the idea that oil's crash was a direct result of the supply glut is erroneous. Case in point: This chart of the week-over-week supply of US crude oil stocks shows that the historic glut we see today didn't occur until months AFTER the collapse in oil prices was well underway. (Source: ycharts)
In fact, predicting oil's 2020 crash was possible only by focusing on a leading indicator, the Elliott wave pattern underway on oil's price chart.
Here, we go back to beginning of 2020, when oil prices were enjoying a 35% rally to 9-month highs.
Then, mainstream energy analysts were looking higher amidst a perfect bullish storm of escalating tensions between the U.S. and major oil producers in the Middle East (see: Soleimani assassination, retaliatory missile strike on U.S. military bases in Iraq, and the Strait of Hormuz closure)
-- AND --
would you believe, a supply... deficit.
Yes, as recently as January all these factors had the pundits "preparing" for oil to be "sent back to $100" (Jan. 8 CNBC). See:
- "JP Morgan Raises 2020 Oil Price Outlook" (Dec. 17 oilprice.com)
- "Falling Supplies Support Crude Oil Rally" (Jan. 8 Seeking Alpha)
- "Oil Surges 35% in 2019 and Hedge Funds are Betting on More" (Dec. 31 CNBC)
The largest oil crash in history occurred -- instead.
That leaves standing the forecasting model of Elliott wave analysis. It started preparing investors for a massive turn in oil prices as early as December 16, 2019 -- before the first coronavirus case was documented on December 31.
Here, we recover these forecasts from the Elliott wave vault:
December 16, 2019, Elliott Wave International's Short Term Update cited the debut of the world's largest, $2 trillion IPO, Saudi Arabia's natural petroleum and natural gas company Aramco as proof that oil bullishness had reached a dangerous peak, warning the "onset of the next far more serious decline in the oil market."
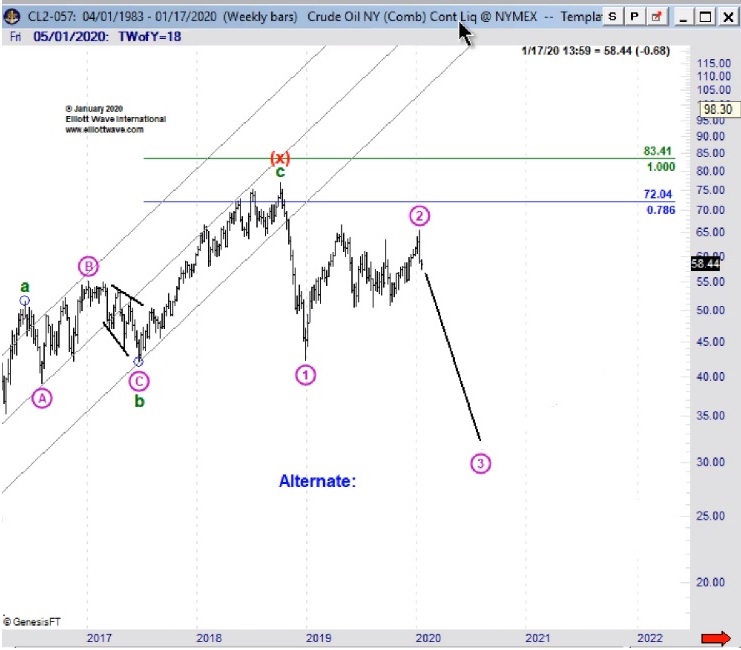
January 17, 2020 Elliott Wave International's Monthly Commodity Junctures called for oil prices to be slashed in half from current levels and said:
"The big narrative when you start looking at the weekly and monthly crude oil charts is -- any strength we see is going to fail."
February 7 Elliott Wave International's Daily Commodity Junctures showed this bearish projection and confirmed oil's trend was now down: "The high of the year is in place in crude oil and we will fall to $33 a barrel -- at minimum."
March 6 Elliott Wave International's Energy Pro Service: "The headlines are likely to cite the lack of a coordinated OPEC production cut as the driver for today's 10% freefall... but it's right in line with our forecast for the downward acceleration in wave 3 of (3). The market should trend on down in an impulsive manner."
March 9 Elliott Wave International's Short Term Update: "Crude oil is on its way to [its lowest level since 1999]."
Predicting negative $40 price per barrel for WTI wasn't possible. It happened in part because CME allowed the contract to be priced below zero to stimulate demand.
The point is: Across several different publications, different Elliott Wave International's analysts were able to maintain a bearish position and anticipate a massive sell-off in crude by using one single forecasting model: Elliott waves analysis.
In fact, Elliott Wave International's President Robert Prechter addressed this very topic at the 2016 Social Mood Conference as part of his keynote presentation. There, Bob discussed the enduring "battle between Elliott waves and the supply/demand theorists" for the title of successful oil forecasts.
There, Bob engages his audience in a 30-minutes slide show of oil charts, newspaper clippings, Elliott wave analysis, and historic data that leads to one dramatic conclusion:
"In truth, the supply/demand model failed to predict any of the dramatic turns in oil prices since 1998."
Remember the 2008 "Peak Oil" climate? That's when a supposed record supply deficit was going to send oil prices to the moon. Instead, Bob Prechter published this bearish warning in his June 2008 Elliott Wave Theorist:
"One of the greatest commodity tops of all time is due very soon," -- a "pretty bold call in the middle of a freight train going up when the world is running out of oil."
The crash from $147 to $32 a barrel in the following five months of 2008 shocked mainstream analysts.
In his presentation, Prechter shows that since 1998, the supply/demand model failed while the Elliott wave model succeeded to forecast 8 major turning points in oil prices. In his words:
"Why do supply/demand theorists fully embrace the trend at the perfectly wrong time, time and again? They do it because their model doesn't work."
And, as the oil crash of 2020 proves, the Elliott wave model still works.
The lessons from Bob Prechter's 2016 presentation are as relevant today as ever. Fortunately, if you weren't there to see it in person, our friends at Elliott Wave International are re-releasing the complete, 30-minute live video footage -- FREE -- to all free Club EWI members.
Free, watch Robert Prechter's timeless 30-minute video right now.
This article was syndicated by Elliott Wave International and was originally published under the headline . EWI is the world's largest market forecasting firm. Its staff of full-time analysts led by Chartered Market Technician Robert Prechter provides 24-hour-a-day market analysis to institutional and private investors around the world.
© 2005-2022 http://www.MarketOracle.co.uk - The Market Oracle is a FREE Daily Financial Markets Analysis & Forecasting online publication.