


Technical Analysis Points To Key Reversal Of Global Markets
Stock-Markets / Financial Markets 2020 May 08, 2020 - 02:55 PM GMTBy: Chris_Vermeulen

Recently, we received a number of email messages and comments regarding our recent Bitcoin article and how we attempted to explain the market trend/technical analysis. It appears we were not making our interpretation very clear for our friends and followers. This article should help to clear up our interpretation of the major market trends and our advanced technical analysis tools and utilities.
As purely technical traders, there are certain things we want to make clear. First, we do pay attention to what is happening to the fundamentals and global economic data when it posts. We’ve authored many previous articles stating our belief that “capital is like a living/breathing entity which attempts to survive (generate ROI with little risk) in various global market environments”. In order for us, as technical traders, to identify real opportunities for superior trades, we must be aware of what is happening in the “environment” that surrounds us.
A perfect example is a recent collapse in oil. We continue to read articles of how thousands of traders believed super-low oil prices were a GIFT and these traders piled into long trades expecting oil to rebound higher. This happens when technical traders fail to understand the environment in which the instrument is trading within. At this time, the supply side for oil vastly outweighs the demand-side – so the environment is skewed towards much weaker price activity. The chance that any moderate price recovery would take place is minimal until the supply glut is diminished.
A Taste of What a Technical Analyst Does Each Day
One of the easiest ways to think of a truly technical trader is that we don’t care if the price goes up or down, we just care that our technical triggers and indicators present clear opportunities that are superior to more traditional methods of trading.
To accomplish this, we believe we must understand the environment in which we are trading and the technical conditions that are present within the charts. Technically, the price may be going up within a defined bearish/downtrend. This does not mean the upside price move is a technically valid “trade trigger”. The opposite may be true for a move down in a bullish trending market. Without proper confirmation of the overall technical bias, environment, and shorter-term technical triggers – one might as well throw a dart at a wall and hope for the best.
In our view, we issue many published research reports for our friends and followers to read and review every week. We show both bullish and bearish potential outcomes and depending on which way the market breaks we will execute trades in that direction. What we do not do, is trade based on forecasts/predictions. Instead, we follow the price.
Our interpretation of the technical triggers, economic data, forward expectations, and other setups are designed to help you learn how we conduct our research and to help you find opportunities in the markets. Our members receive this same research and more – they receive our hand-selected trade triggers. These are the best technical setups/trade triggers known as BAN Trades (Best Asset Now) so we can find that provide superior opportunities for skilled traders.
Before you continue, be sure to opt-in to our free market trend signals before closing this page, so you don’t miss our next special report & signal!
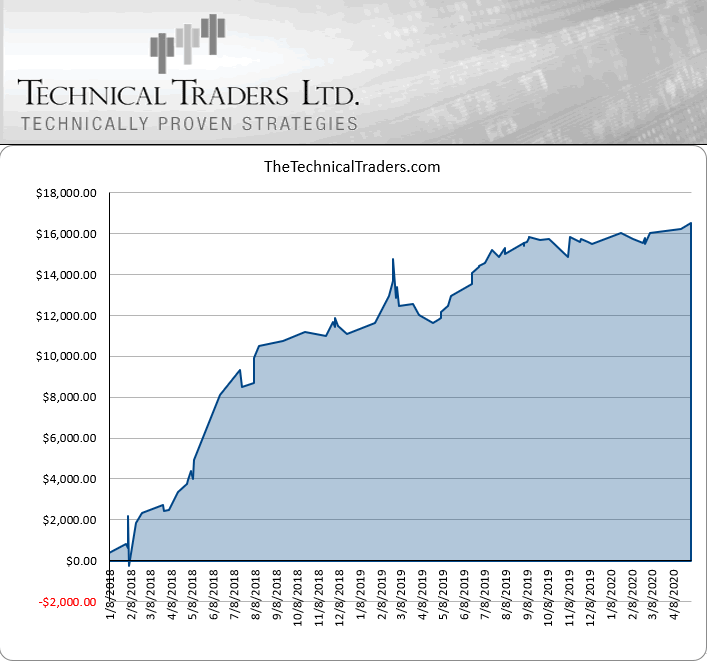
This chart, below, shows our historical results for the past 2.5 years. You’ll notice that we do sometimes take losses – yes. You’ll also notice the consistency of the profits – yes. We hope you’ll also notice that we work very hard to make sure our member’s success is the first priority in everything we do.
2020 has been a slow year for overall portfolio gains simply because of the market crash and extreme volatility. My #1 goal is to trade when risk is manageable, and the market is predictable. Don’t get me wrong, we have made money on the SPY, over 20% in TLT, 9.5% in GDXJ, and yesterday we locked in 11% on natural gas, so we are trading. But position sizes are small in comparison to our overall portfolio value so we don’t get oversized portfolio growth. When indexes, sectors, and commodities are moving 10-90% a day, it’s a time when position sizing becomes curial for survival.
You will not notice the market crash this year had no impact on our account because we did one of the best trades during the unexpected and unpredictable crash, we moved to 100% cash. Our results are based on a $20K account and over the past 2.5 years we are averaging 33% ROI with very little drawdowns.
Now, back to technical analysis…
Our research team believes the markets have set up a massive downside price advance (creating a much deeper low that confirms Fibonacci price theory and aligns with our Fibonacci Price Amplitude Arcs), which sets up a very unique technical pattern. Until the price is capable of establishing a series of new higher-high points through consecutive upside price advances AND until the Weekly and Monthly charts confirm a new high price breakout – technically speaking, we’re still in a bearish price trend.
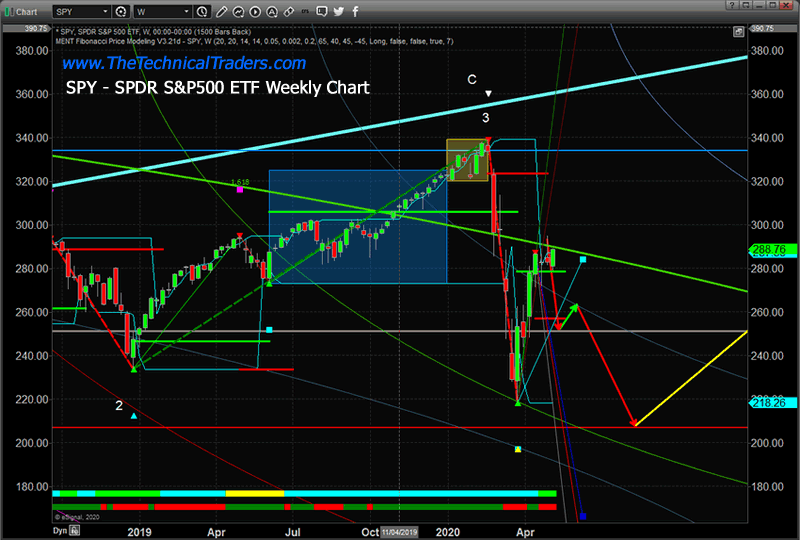
Weekly S&P 500 (SPY) Chart
This Weekly SPY chart, below, shows you three key technical factors that tell us there is a greater risk of a breakdown in price than any upside price trend continuation…
A. The recent low/bottom price level broke below the December 2018 low price level (new lower low).
B. The GREEN ARC price level is a massive 1.618 Fibonacci Price Amplitude Arc that suggests massive resistance exists at this level. Price moving above this level then falling back below it suggests a “scouting pattern” type of event took place and FAILED.
C. Recent price activity has rallied from recent lows too, again, reconfirm the GREEN ARC resistance level. We believe this Fibonacci Price Amplitude Arc will present a major price ceiling as Q2 and Q3 economic data pushes forward – driving the price lower over time and eventually targeting the RED support level near $208 in July or August.
You may remember that we’ve been suggesting a bottom will not complete until sometime after July or August 2020 in previous research posts. Now you know where we derive these projections and expectations, we use technical analysis and our advanced predictive modeling tools to “see into the future”. Believe it or not, we’ve already mapped out SPY price activity 10+ years into the future.
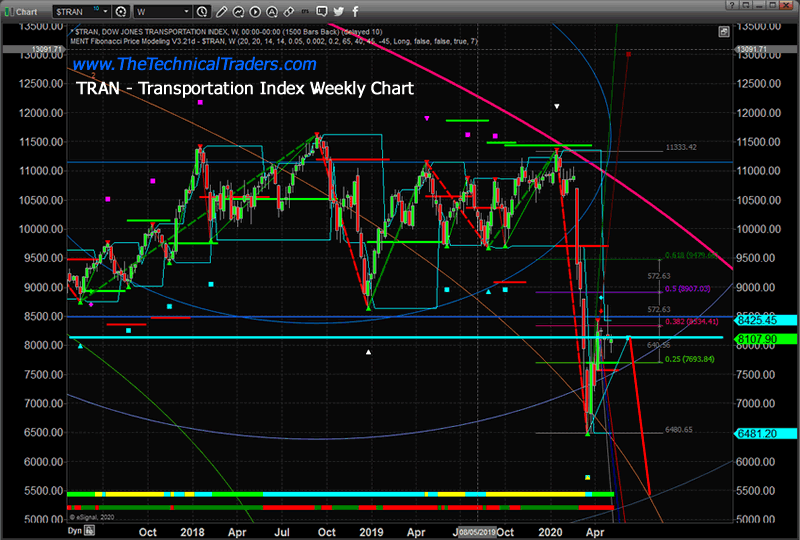
Weekly Transportation Index (TRAN) Chart
This TRAN Weekly chart also helps to confirm our technical analysis research. We are deploying the same types of technical analysis tools on all of these charts to show you how our research team attempts to identify trends and opportunities. You can see the heavy LIGHT RED Fibonacci Price Amplitude Arc near the peak in February 2020. This Arc represents a massive price resistance channel. You may also notice the thinner ORANGE Fibonacci Price Amplitude Arc that touches recent lows? This arc acts as Support in its current form.
Our proprietary Adaptive Fibonacci Price Modeling System is drawing a CYAN projected target level from recent lows where the heavy CYAN line is displayed on this chart. Additionally, a previous BLUE target level is also displayed on this chart which originated from the recent PEAK in February 2020. Now, pay attention to where the TRAN price has found recent resistance and stalled… RIGHT AT THOSE LEVELS.
We believe the failure of the SPY and TRAN to move above the ARCs and Fibonacci price targets suggests a critical upward price trend failure. A failure of this nature will prompt a new downside price move in the near future as price must always attempt to establish new price highs or new price lows based on the Fibonacci Price Theory (technical analysis).
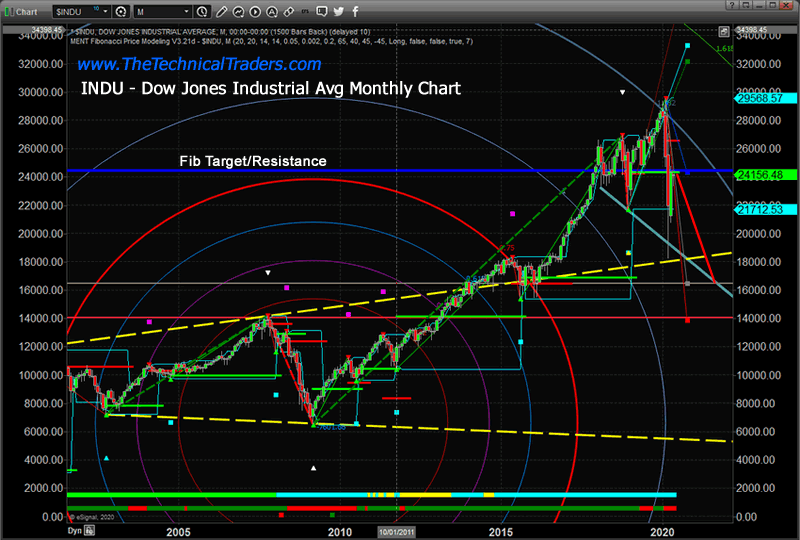
Monthly Dow Jones Industrial (INDU)
This last chart, the Monthly INDU, is probably the most impressive one so far. Clear Fibonacci Price Amplitude Arcs suggest massive resistance near the February 2020 peak levels. A very clear downward price channel originating from the February 2018 lows and transitioning across the December 2018 lows and into current lows. An Adaptive Fibonacci Price Modeling System target price (CYAN) near 8108 (very near current price levels) and a very clear technical price pattern (Dojis) suggesting a potential top or price reversal is setting up. Lastly, the recent deep low price stalled very near to the historical YELLOW DASHED price channel that spans the 2000 and 2007 price peaks.
Pulling all of this technical analysis together with simple Fibonacci Price Theory suggests that until the markets can prove to us that price is capable of establishing we upside price structures, the recent deep new price low (near 18,265) suggests future price action may collapse even further and attempt to establish a new, deeper, “new price low” before the real bottoms set up in the markets. On this INDU chart, it suggests that a “deeper price low” may result in a move well below the YELLOW DASHED price channel from 2000/07 and attempt to move to the RED Fibonacci Price Target level near 14,000.
Concluding Thoughts:
Obviously, we are still very bearish in terms of the current overall market trend. No technical analysis technique has shown us that the intermediate and longer-term trends have changed direction to Bullish. Yes, our Daily systems did identify a bullish trigger within this bearish trend on the SPY which we executed successfully for our members. There is an opportunity to take a bullish trade within a bearish price trend when technical analysis confirms the trigger and it is executed properly.
If you are using our free public research for your own trading decision-making and/or using it as an opportunity to find and execute successful trades, please remember you are the one ultimately making the decisions to trade based on our interpretation and free research posts. We, as technical traders, will continue to post new research articles and content that we believe is relevant to the current market setups.
If you want to improve your accuracy and opportunities for success, then we urge you to visit www.TheTechnicalTraders.com to learn how you can enjoy our research and our members-only trading triggers (see the first chart in this article). If you are managing your retirement account or 401k, then we urge you to visit www.TheTechnicalInvestor.com to learn how to protect your assets and grow your wealth using our proprietary longer-term modeling systems. Our goal is to help you find and create success – not to confuse you.
Our researchers will generate free research on just about any topic that interests them. As technical traders, we follow price, predict future price moves, tops, bottoms, and trends, and attempt to highlight incredible setups that exist on the charts. What you do with it is up to you. Visit www.TheTechnicalTraders.com/FreeResearch/ to review all of our detailed free research posts.
In closing, we would like to suggest that the next 5+ years are going to be incredible opportunities for skilled traders. Remember, we’ve already mapped out price trends 10+ years into the future that we expect based on our advanced predictive modeling tools. If our analysis is correct, skilled traders will be able to make a small fortune trading these trends and Metals will skyrocket. The only way you’ll know which trades to take or not is to become a member.
Chris Vermeulen
www.TheTechnicalTraders.com
Chris Vermeulen has been involved in the markets since 1997 and is the founder of Technical Traders Ltd. He is an internationally recognized technical analyst, trader, and is the author of the book: 7 Steps to Win With Logic
Through years of research, trading and helping individual traders around the world. He learned that many traders have great trading ideas, but they lack one thing, they struggle to execute trades in a systematic way for consistent results. Chris helps educate traders with a three-hour video course that can change your trading results for the better.
His mission is to help his clients boost their trading performance while reducing market exposure and portfolio volatility.
He is a regular speaker on HoweStreet.com, and the FinancialSurvivorNetwork radio shows. Chris was also featured on the cover of AmalgaTrader Magazine, and contributes articles to several leading financial hubs like MarketOracle.co.uk
Disclaimer: Nothing in this report should be construed as a solicitation to buy or sell any securities mentioned. Technical Traders Ltd., its owners and the author of this report are not registered broker-dealers or financial advisors. Before investing in any securities, you should consult with your financial advisor and a registered broker-dealer. Never make an investment based solely on what you read in an online or printed report, including this report, especially if the investment involves a small, thinly-traded company that isn’t well known. Technical Traders Ltd. and the author of this report has been paid by Cardiff Energy Corp. In addition, the author owns shares of Cardiff Energy Corp. and would also benefit from volume and price appreciation of its stock. The information provided here within should not be construed as a financial analysis but rather as an advertisement. The author’s views and opinions regarding the companies featured in reports are his own views and are based on information that he has researched independently and has received, which the author assumes to be reliable. Technical Traders Ltd. and the author of this report do not guarantee the accuracy, completeness, or usefulness of any content of this report, nor its fitness for any particular purpose. Lastly, the author does not guarantee that any of the companies mentioned in the reports will perform as expected, and any comparisons made to other companies may not be valid or come into effect.
Chris Vermeulen Archive |
© 2005-2022 http://www.MarketOracle.co.uk - The Market Oracle is a FREE Daily Financial Markets Analysis & Forecasting online publication.