Covid-19: Major Risks as US Eyes Re-Open
Economics / Coronavirus Depression May 07, 2020 - 02:48 PM GMTSUMMARY
This article provides a quick review of the current state of the US lock-down in response to the COVID-19 pandemic. Major risks lie ahead in terms of re-starting the US economy without re-igniting the spread of the COVID-19 coronavirus.
- Current number of active cases is 50x the number when US lock-down started
- Peak number of US active cases still not yet reached, and likely weeks away
- Peak number of deaths for US in a day, observed relatively recently
- Model projections are predicting at least 100,000 US deaths by May 31
- Contact tracing in today’s complex society is a major problem to overcome
- The US is now in a recession that could last at least 12 to 18 months
US LOCKDOWN
In mid-March 2020, the US enforced a country-wide lock-down to contain the spread of the coronavirus and reduce the burden on both the healthcare system and on the first responders. Nevertheless, as the country starts to plan for a re-open of the economy, there are currently 50x the number of active cases, when compared to the number when the lock-down started. This is still a huge hurdle to get over, with inherent risks.
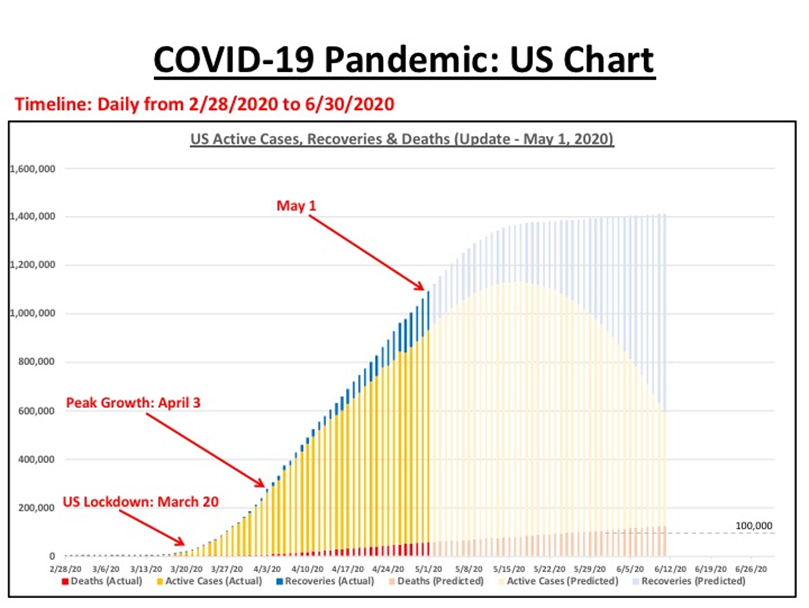
At the point when the US lock-down started there were approximately 18,000 known active cases, and now that number has risen to a staggering 900,000 active cases. This number is still increasing on a daily basis and has not yet reached a peak, which is still at least some weeks away (see chart below). Modeling projections put the eventual peak active cases at least 10% to 20% higher than the current number of around 900,000 known active cases, as of May 1, 2020, and perhaps even higher.
As a definition, current number of active cases today is calculated as follows:
AC[Today] is Active Cases Today
AC[Yesterday] is Active Cases Yesterday
NC[Today] is New Cases Today
NR[Today] is New Recoveries Today
ND[Today] is New Deaths Today
AC[today] = AC[yesterday] + NC[Today] – (NR[Today] + ND[Today])
MATHEMATICAL MODELING OF THE SPREAD OF COVID-19
The chart below shows the current situation for the US as of May 1, 2020 with projections out to mid-June. The chart is derived from a model developed in MS Excel, using data sources from WHO, CDC and John Hopkins University. Data has been captured daily since early March.
Key dates shown on the chart are the date of the lock-down (Friday, March 20), the peak growth in active cases (Friday, April 3) and the most current date for actual recorded data (Friday, May 1). Peak growth on April 3 was approximately the day when the number of active cases was growing the fastest. The growth rate has since slowed, allowing for a peak to start to form.

MASKS, TESTING AND CONTACT TRACING
Three key factors will determine how well the US and other countries weather the pandemic, successfully re-opening their countries and re-starting their economies. These factors are physical protection, testing at scale and continued contact tracing.
Social distancing with face protection is essential to getting the R0 figure down to a number less than one. For a particular disease, the number R0 is the number of new infected people that become infected from an initial infected person. If R0 can be reduced to less than one (R0 < 1.0), then the spread of the disease will dissipate and eventually disappear. The biggest risk here is people’s behavior and their continued focus on maintaining social distancing and adherence to wearing a face mask.
Testing capability is increasing as more and more testing is brought inline. This covers both diagnostic testing (who has the virus) and anti-body testing (who has previously had the virus). The biggest risk here is whether immunity is developed with anti-bodies or not. This fact is not yet known but will play an integral part in how we deal with COVID-19.
Contact tracing must be executed on a massive scale, however, it is increasingly complex in today’s open society. For example, if a particular individual tends to travel mostly between home and work, with occasional meetings with family and friends, then contact tracing is relatively easy to accomplish. Each person who the individual comes in contact with, is traceable. A large team of contact tracers can establish the connections.
However, if the same individual is in an elevator with random members of the public, or in a store shopping, or at a bus stop, or train station, or on a bus/train, or in a hospital waiting area. Then the issue of contact tracing becomes much more difficult. The spread to random members of the public is largely un-traceable. The major risk here is the case that the un-traceable contacts become large in relation to the traceable contacts.
US EQUITY MARKETS
The drop in the US equity markets was swift and severe in response to the COVID-19 pandemic. Over 30% of the major US averages lost in a little over one month. This has left the US economy, and many other economies around the world, looking at the beginning of an economic recession. Massive unemployment across the globe as a result of the self-imposed lock-downs. The risk here is whether this is going to be just a recession or something much worse, like the US Great Depression of 1929 to 1933.
US RECESSION & GLOBAL RECESSION
It’s probable that a US recession most likely started in Q1 of 2020, and if not Q1, then certainly Q2, 2020. We will need to wait many months before the National Bureau of Economic Research (NBER) provides its definitive adjudication of when the actual US recession started. Going back to the 1960s, US recessions have not been quick, with a typical length of between 7 months and 19 months, and with an average length of 13 months. We have just witnessed the longest recession-free period in US history (2009 to 2020), so this recession is likely to be at the upper end of the range, say 12 to 18 months.
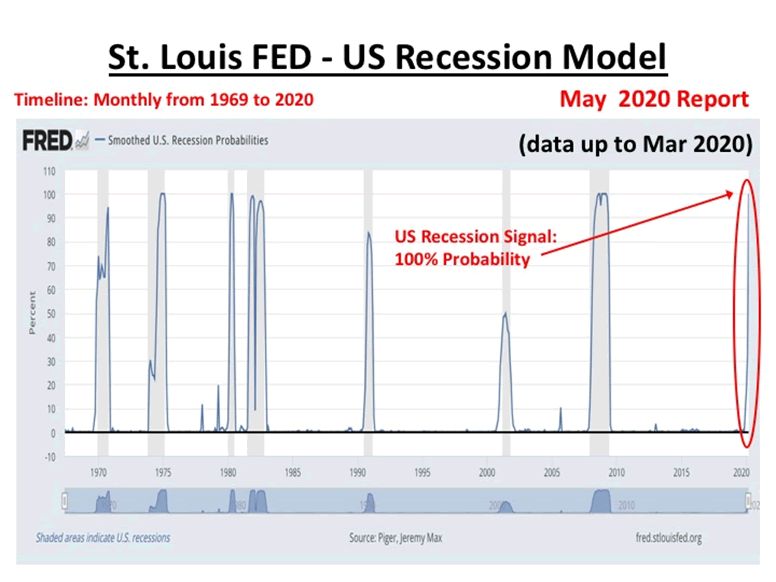
The Federal Reserve Bank of St. Louis publishes a monthly report presenting the output from its smoothed US recession probabilities model. The most recent report was published last week on Friday, May 1, 2020. The data in the report is delayed by 2 months, hence the May report covers the time period up to March 2020.
The St. Louis FED model was originally developed by Marcelle Chauvet and presented in the paper ""An Economic Characterization of Business Cycle Dynamics with Factor Structure and Regime Switching". Additional work, including an analysis of the performance of the FED model, was completed by Marcelle Chauvet & Jeremy Piger and presented in the paper "A Comparison of the Real-Time Performance of Business Cycle Dating Methods". Links to these papers (in PDF form) can be found on the St. Louis FED website.
The chart below shows an example from this month's May 2020 report. The vertical grey bars indicate US recessions, as defined by NBER, and the blue line shows the smoothed US recession probabilities. The report is currently showing the probability that a US recession has started in Q1/Q2 is now 100%. The question now is how severe will it be?

In Q3/Q4 of 2019 and early 2020, my mathematical models of the US stock market were already predicting weakness across the major indexes in the period March 1, 2020 to April 30, 2020, and the strong likelihood of a US stock market top during that period. The sudden arrival of the COVID-19 pandemic is the black swan event that took a vulnerable US equity market and sent it into a desperate downward spiral.
CONCLUSIONS
As the US plans to re-open the country and re-start the economy in phases, the date to begin the re-start appears (from the modeling) to be still some weeks away. The attempts by some US States to start to re-open this week (April 27 to May 3), may potentially backfire. Major risks still remain, and attention must be given to ensuring that American’s maintain their behavior of social distancing and wearing face protection. We can all hope that a viable vaccine is not too far away.
The US Fed responded quickly to counteract the problems caused by the economic lock-down resulting from the COVID-19 pandemic. Despite this effort, the US is likely now in the beginning of a severe recession, lasting between 12 and 18 months minimum.
If the US States open up too quickly, the pandemic may re-emerge, and if the US States take too long to open up, the severity of the recession may escalate. A fine balancing act if ever there was one.
By Dr. David J. Harris
Disclosure: The author has no positions in any stocks mentioned, and no plans to initiate any positions within the next 72 hours.David Harris is an independent stock market investor and trader with an interest in modeling price movements in stock markets. In particular, David has spent the last fourteen years developing mathematical models to identify market tops and market bottoms and more recently a model that identifies bubbles in national stock market indices and individual stocks. Trained originally as an Electronic Engineer, David has a First Class Honors Degree in Electronic and Electrical Engineering from Leeds University, UK and a PhD in Adaptive Control Algorithms (machine learning), also from Leeds University. David has worked as a Senior IT Manager in the City of London and more recently in New York City for a variety of Investment Banks, including NatWest Markets, Bankers Trust, Deutsche Bank, Bank of Bermuda, HSBC Bank and Societe Generale.
© 2020 Copyright Dr. David J Harris - All Rights Reserved Disclaimer: The above is a matter of opinion provided for general information purposes only and is not intended as investment advice. Information and analysis above are derived from sources and utilising methods believed to be reliable, but we cannot accept responsibility for any losses you may incur as a result of this analysis. Individuals should consult with their personal financial advisors.
© 2005-2022 http://www.MarketOracle.co.uk - The Market Oracle is a FREE Daily Financial Markets Analysis & Forecasting online publication.


