Britain's FAKE Coronavirus Death Statistics Exposed
Politics / Pandemic May 04, 2020 - 01:01 PM GMTBy: Nadeem_Walayat
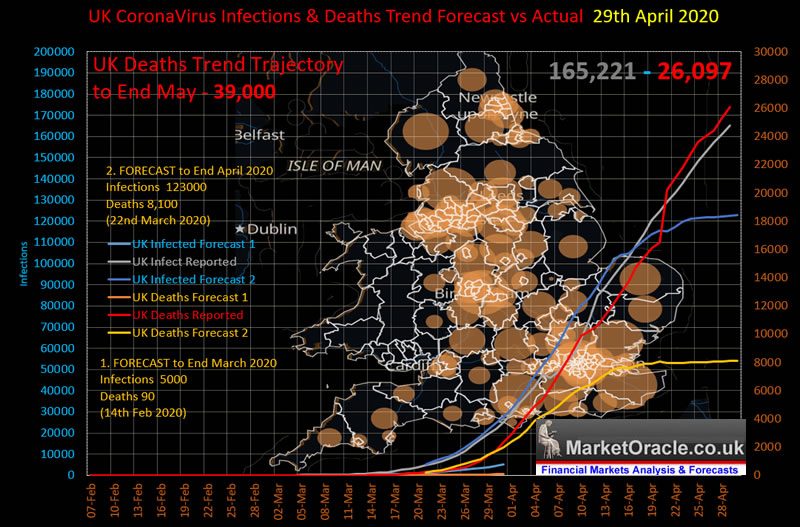
The UK death toll has sky rocketed to over 26,000! Well beyond that which anyone could have imagined in lockdown Britain a month ago! All this whilst lockdown Britain continues without end with the government financing 80% of MOST workers wages, bailing out corporations and underwriting small business loans up to the tune of £50k each, canceling £36 billion of NHS Debt and on it goes, the final bill for which could exceed £1 trillion! All whilst the Bank of England quietly prints money to monetize UK government debt that will have inflationary consequences as consumer prices soar.

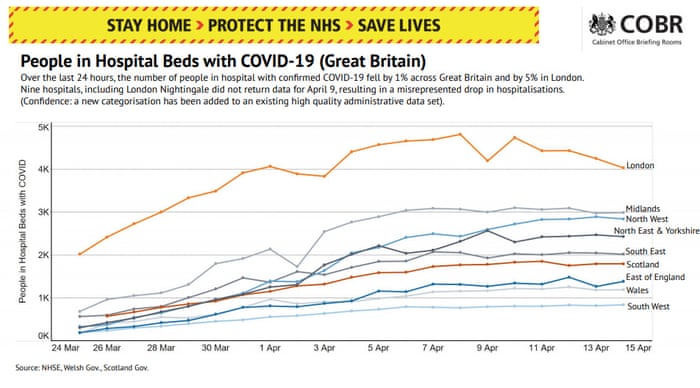
The trend trajectory that includes a moderation of sorts in the UK death rate now projects to 39,000 deaths by the end of May. Compare this to barely 10 days ago when the governments mad scientists were peddling a line of having flattened the curve with politicians at the daily press briefings thanking the general public for staying at home and flattening the curve and saving NHS as the statistics showed that the number of Covid-19 hospital admissions were falling as were their daily number of deaths.

So what went wrong? Why has the total number of UK deaths sky rocketed?
We'll as I pointed out in my analysis of the 6th of April, the UK government was grossly underestimating the number of deaths as all those who died outside of hospitals were NOT being counted. My estimate at the time was that the actual number of EXTRA deaths would be around 44% higher. However, when the ONS published their delayed data on the total number of registered deaths the actual number of deaths jumped by 60% for the week ending 3rd of April and by 80% for the following week ending 10th of April as tables illustrate.


So basically the NHS was saved by patients infected with Covid-19 NOT being allowed to come to hospital so that the government could propagate propaganda of their mad scientists having successfully flattened the curve. However, by late April this smoke and mirrors exercise was no longer sustainable as the number of EXTRA deaths outside of hospitals started to perk the attention of the mainstream media, where extra deaths were starting to exceed the number of deaths in hospitals, and unlike China the UK could not hide the bodies in mass graves or with mass cremations. So have been forced to include MOST EXTRA out of hospital deaths. I say most because the government is still not including about 15% of extra deaths, still the current numbers are a lot more accurate then they have been since the Governments Coronavirus propaganda exercise began with their daily briefings Mid March.
Implied Case Fatality Rate
In terms of what this means for the case fatality rate, well taking today's official statistics of 26,000 deaths divided by 165,000 positive tests resolves to a shockingly high CFR of 15.8%! However the real number of infected is anywhere from X10 to X30 tested. However, it is not as straightforward as just multiplying 165k by say 20 because those dieing today would have been infected 3-5 weeks ago when the total number of infected was a lot lower at 25,000 (4 weeks ago). So 25,000 X 20 equals 500,000, dividing 26,000 into 500k resolves to a CFR of 5.2%! So about 52 times more deadly than the flu!
Which means if 60% of the UK population were to become infected for herd immunity purposes than an EXTRA 2 million people could die!
Which means it is going to be tough for the UK to escape lockdown's as there are going to be several more pandemic waves to come until a vaccine or therapeutics that actually work appear as the likes of Hydrosychloroquine has been found NOT to be effective. Though Gilead's Remdesivir is showing promising signs.
However, real CFR will likely turn out to be lower than 5.2% (hopefully) but not by much. Where the sum of my analysis to date is resolving to the CFR that I first concluded in late January 2020, a number that has cropped up several times during my subsequent analysis as being probable during what has transpired over the past 3 months.
30th Jan 2020 - Coronavirus Infections Spread vs Forecast - 30th Jan 2020 Pandemic Update
My analysis and concluding forecast of 28th January based on data up until the 27th of January utilised trend analysis to forecast that the Coronavirus could infect over 1 million people by the end of February 2020, which given the apparent fatality rate of 3.5% at the time converted into an death toll of at least 35,000. Which if it transpired would be far worse than the 2002-2003 SARS pandemic that infected 8,098 over 8 months resulting in 774 deaths, and this the Coronavirus would have significant economic and market consequences.
So it seems highly probable to me that the overall case fatality rate for reliable numbers of infected and deaths will turn out to be about 3.5%. Which means the Coronavirus IS about 35 times more deadly than seasonal flu so not something to be brushed aside as many wanting an end to the lockdown's in the US especially are striving towards. That is just asking for trouble!
On a side note I looked at including Gilead Mid 2019 in my list of AI stocks when it was trading at around $65 however it was just not quite big enough in terms of market cap and lacked a positive trend trajectory i.e. had basically gone nowhere for several years so was deemed to be too high a risk to make it onto my list.
The rest of this extensive analysis has first been made available to Patrons who support my work: AI Mega-trend Stocks Buying Levels Q2 2020
- Stock Market Trend Forecast Summary
- Britain's FAKE Coronavirus Death Statistics Exposed
- Implied Case Fatality Rate
- United States Coronavirus Trend Trajectory Update
- Perceiving Coronavirus as a Disruptive Technology
- The AI Mega-trend
- When to Sell Your AI Stocks
- AI Mega-trend Stocks Buying Levels Q2
So for immediate first access to ALL of my analysis and trend forecasts then do consider becoming a Patron by supporting my work for just $3 per month. https://www.patreon.com/Nadeem_Walayat.
And ensure you are subscribed to my ALWAYS FREE newsletter for my next in-depth analysis.
Your Analyst
Nadeem Walayat
Copyright © 2005-2020 Marketoracle.co.uk (Market Oracle Ltd). All rights reserved.
Nadeem Walayat has over 30 years experience of trading derivatives, portfolio management and analysing the financial markets, including one of few who both anticipated and Beat the 1987 Crash. Nadeem's forward looking analysis focuses on UK inflation, economy, interest rates and housing market. He is the author of five ebook's in the The Inflation Mega-Trend and Stocks Stealth Bull Market series that can be downloaded for Free.
 Nadeem is the Editor of The Market Oracle, a FREE Daily Financial Markets Analysis & Forecasting online publication that presents in-depth analysis from over 1000 experienced analysts on a range of views of the probable direction of the financial markets, thus enabling our readers to arrive at an informed opinion on future market direction. http://www.marketoracle.co.uk
Disclaimer: The above is a matter of opinion provided for general information purposes only and is not intended as investment advice. Information and analysis above are derived from sources and utilising methods believed to be reliable, but we cannot accept responsibility for any trading losses you may incur as a result of this analysis. Individuals should consult with their personal financial advisors before engaging in any trading activities.
Nadeem Walayat Archive |
© 2005-2022 http://www.MarketOracle.co.uk - The Market Oracle is a FREE Daily Financial Markets Analysis & Forecasting online publication.


