The Gold Bull Market Remembers How Gordon Brown Sold Half of Britains Reserves at the Lowest Price
Commodities / Gold & Silver Apr 01, 2007 - 07:58 PM GMTBy: Clive_Maund
 An increasing number of goldbugs and traders are getting bewildered and frustrated at gold's pedestrian performance and refusal to break higher, even with a possible attack on Iran looming, especially as oil has been romping ahead, and are, of course, looking around for people to blame, which usually winds up being the poor old cartel, those dastardly faceless individuals whose job it is to suppress the price of gold and silver so that the financial world at large doesn't cotton on to the precarious state of the world financial system in general and the Fiat money system in particular, much less mortgaged-up-to-the-hilt Joe Sixpack, whose chief distinguishing feature is that he hasn't got a clue about anything, apart from the details of upcoming ball games etc.
So let's open the windows and let in a big blast of fresh air, which we will do by standing back and looking at the long-term chart for gold. As we shall see, by stripping out the day-to-day noise that can get the best of us confused, the situation becomes remarkably clear.

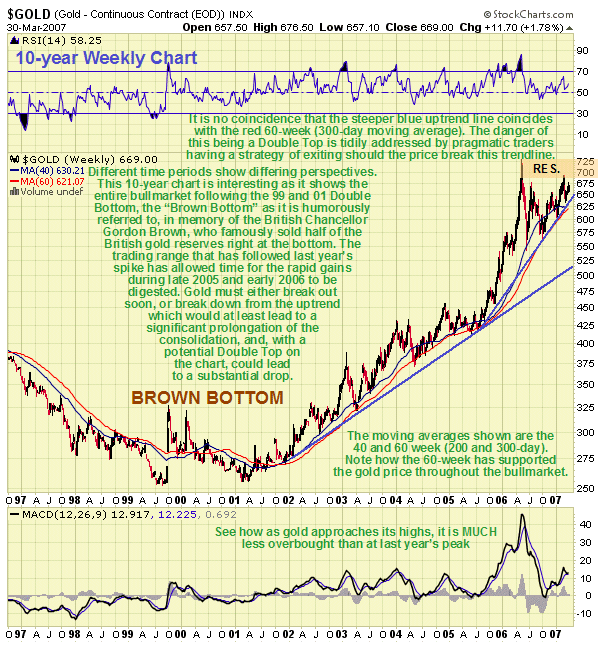
Our 10-year gold chart shows not only the entire bull market, but the famous, or perhaps infamous "Brown Bottom", the low point gouged out by industry stalwart Barrick Gold, which was not held in the highest esteem by its peers due to its persistent and substantial hedging of gold, and by the British Chancellor of the Exchequer, Gordon Brown, who sold half of Britain's gold reserves at the bottom, actually managing to sell at the lowest possible price by announcing his intentions in advance.
A key point to observe is how the gold bull market moved up a gear when the advance accelerated in the fall of 2005, becoming very steep in the early part of last year, leading to an extremely overbought condition, dramatically illustrated by the MACD indicator shown at the bottom of the chart, and temporary burnout. This naturally called for consolidation/reaction, which has been the condition of this market ever since. There is good reason to suppose that the increased rate of advance is set to continue. Another key point to observe is how gold has found support at the 60-week (300-day) moving average throughout the bullmarket, with the price correcting very close to this moving average last October, and how this average continues to underpin the price as it advances again to challenge last year's high.

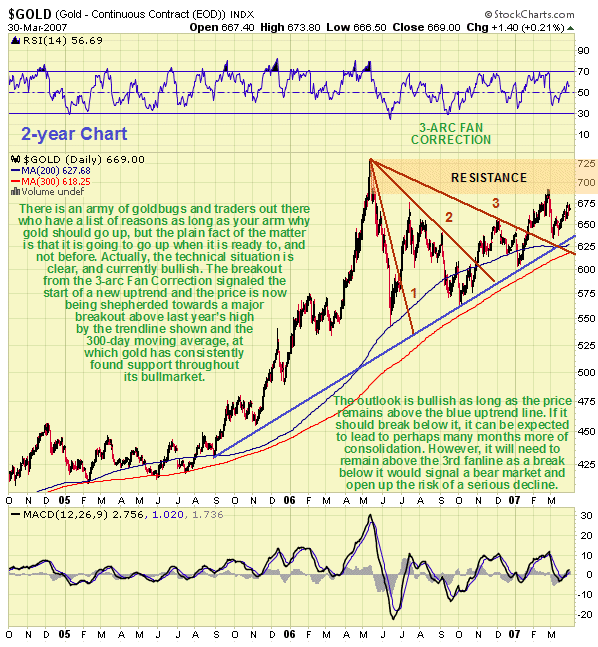
We will now turn to a 2-year chart to examine the entire period including the strong advance from September 2005 and the subsequent consolidation/reaction following last year's high in more detail. On this chart we can see that the corrective phase was actually completed when the price broke out from the 3-arc Fan Correction in January, since which time it has advanced into the resistance towards the highs, before staging a classic reaction back to test support above the 3rd fanline before turning higher again. With the blue trendline and the 300-day moving average shepherding the price ever higher, it will soon be forced to take on - and overcome - the resistance approaching last year's highs , or break down, which could signify completion of a Double Top, but more likely would lead to a prolongation of the period of consolidation, perhaps for many months.
At this point, the chances of it breaking out upside are regarded as significantly higher than the chances of a breakdown, and we are therefore positioned to take advantage of the expected upside breakout. Our strategy is to be committed to the long side in gold and gold stocks and ETF's and options, but to be ready to exit should gold break below the blue trendline by a significant margin, which at the least would be expected to lead to a prolongation of the consolidation pattern involving a significant intermediate reaction, and at worst would signify completion of a Double Top that would lead to a substantial drop. In the event of such a breakdown there is always the option of re-entering positions closed out if the situation later improves, although it is recognized that this strategy risks incurring whipsaw losses, which would, however, be quantified and limited. Thus we are in position to take advantage of an upside breakout by gold that should lead to a strong advance, but if it breaks down we won't be around to suffer the significant losses that may result.
Silver looks considerably more vulnerable than gold right now, and as it is hardly likely that one will one go through the roof while the other plunges, this gives grounds for concern. The COT structure is a little more bearish this week.
By Clive Maund
CliveMaund.com
The above represents the opinion and analysis of Mr. Maund, based on data available to him, at the time of writing. Mr. Maunds opinions are his own, and are not a recommendation or an offer to buy or sell securities. No responsibility can be accepted for losses that may result as a consequence of trading on the basis of this analysis. Mr. Maund is an independent analyst who receives no compensation of any kind from any groups, individuals or corporations mentioned in his reports. As trading and investing in any financial markets may involve serious risk of loss, Mr. Maund recommends that you consult with a qualified investment advisor, one licensed by appropriate regulatory agencies in your legal jurisdiction and do your own due diligence and research when making any kind of a transaction with financial ramifications.
© 2005-2022 http://www.MarketOracle.co.uk - The Market Oracle is a FREE Daily Financial Markets Analysis & Forecasting online publication.


