


Downside Market Tradining Opportunities Everywhere – Watch These Symbols
Stock-Markets / Financial Markets 2020 Apr 16, 2020 - 02:04 PM GMTBy: Chris_Vermeulen

As the global markets enter the Q1 earnings season where a host of new data and expectations will flood the markets over the next 30+ days, skilled traders should put these three symbols on their watch-list over the next few days and weeks.
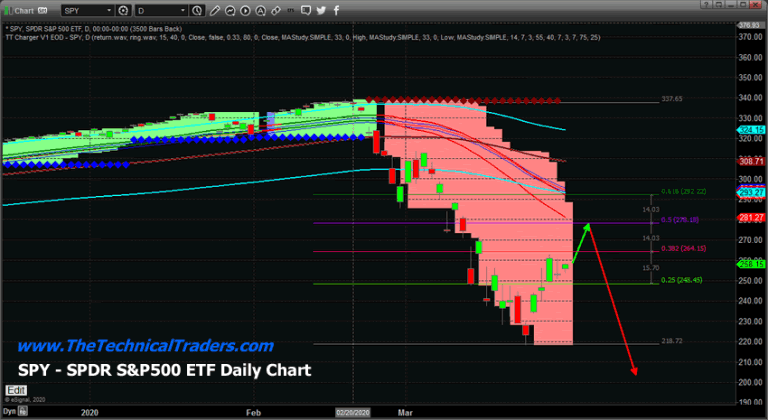
We’ve been writing about how we believe the downside risks within the US and global stock markets are still very real. Many industry analysts believe the bottom has set up in the US stock market already – we don’t believe this is the case. Our Adaptive Fibonacci Price Modeling system continues to suggest a deeper downside move is in the works and we believe this potential retest of recent lows will setup another incredible opportunity for skilled traders.
Recently, we’ve posted a number of research articles to help you understand what is really taking place in the global markets. The COVID-19 virus has set-off a consumer demand contraction event that will ripple across all sectors of the global economy. There is no other way to interpret the data right now – if consumers don’t come back into the economy at levels near the late 2019 engagement levels, then the global economy will continue to contract. Consumers make up over 85% of GDP values.
Here are some of our most recent articles to assist you…
Now, onto the three symbols setting up an incredible upside opportunity if the global markets rotate lower as our predictive modeling is suggesting…
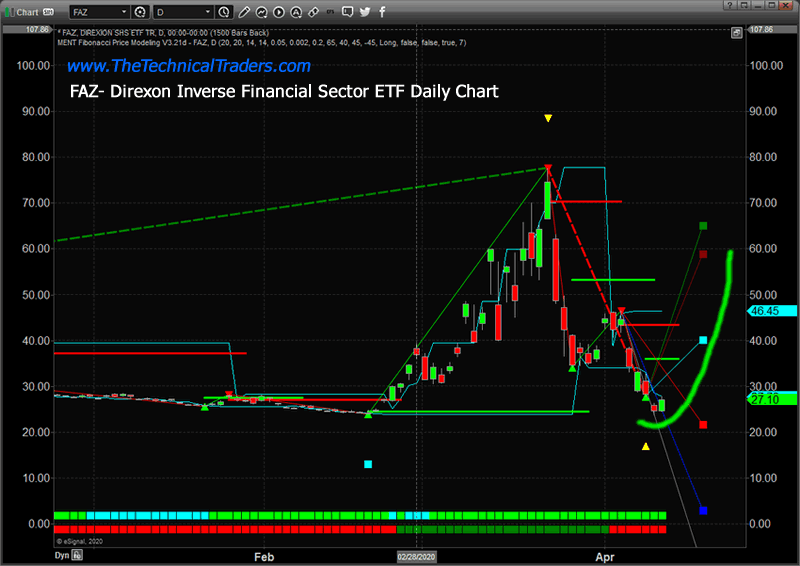
FAZ – Direxon Inverse Financial Sector ETF
The first symbol is FAZ. This ETF moves higher as the financial sector stocks move lower. These include banks, financial institutions, and other financial services companies. The reason we believe FAZ has a potential to move higher is that we believe the lack of consumer engagement in retail, restaurants, leisure shopping and other types of normal spending activities will put incredible pressure on business loans, consumer loans, commercial and residential real estate, business credit lines and many other aspects of the financial sector. Simply put, it would be foolish to think that some level of default and/or extended risks would not come from any type of consumer disengagement from the economy. Again, consumers make up over 85% of the total GDP levels. If we take away even 20% to 30% of these consumers, we could see a dramatic collapse in certain sectors of the economy.
Thus, we believe the Financial sector is poised for another downside price move which will prompt a rise in FAZ from current levels to near $50~$60. This represents 65% to 85%+ upside potential.
Before we continue, be sure to opt-in to our free market trend signals before closing this page, so you don’t miss our next special report!
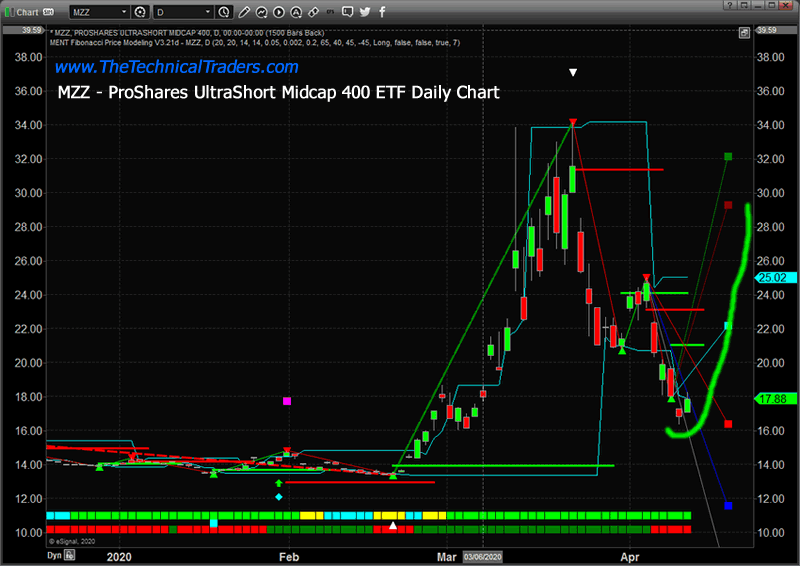
MZZ – ProShares UltraShort Midcap 400 ETF.
The MidCap sector is uniquely vulnerable to any economic contraction related to consumer activity. Many of the Midcap companies are uniquely consumer-based and/or consumer sector related. Thus, should another market downtrend attempt to retest recent lows or attempt to set up a deeper price bottom, the Midcap 400 ETF may see an incredible upside price move. Upside price targets are near $29 to $30 – which is 55% to 65% higher than the current price level. Ultimately, any deeper price lows set up because of a deeper price bottom setting up in the US and global markets could push MZZ well above $35.
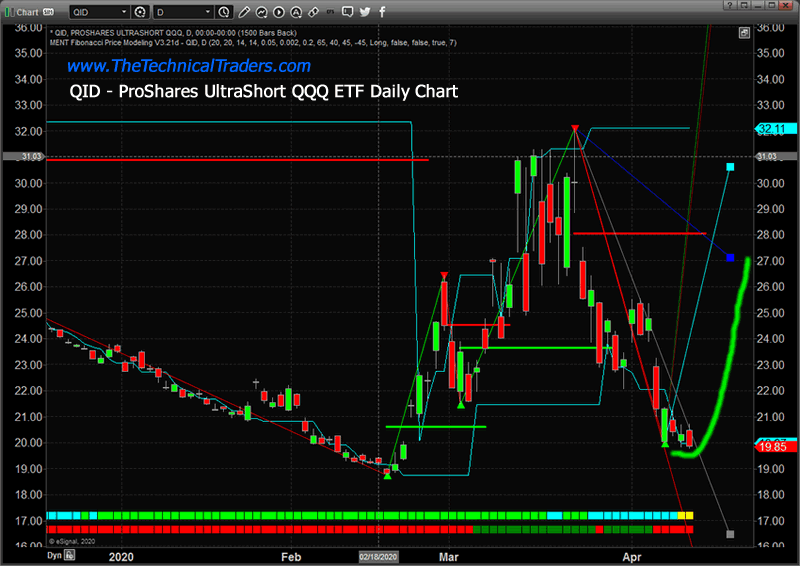
QID – ProShares UltraShort QQQ ETF
The last symbol we believe could see a big upside move related to increased future risk in the US and global markets is QID – the NASDAQ Inverted ETF. The reason we believe risks in the US and global major markets may bleed over into this ETF is that the NASDAQ has been a major component of US & foreign investment over the past 24+ months. Global investors continue to believe that technology firms will out-perform the general market – thus, more capital has poured into this sector of the market over the past 20+ months than many other sectors.
This capital influx also creates an opportunity for contrarian traders if the markets fail to recover – as many people believe will happen. This capital that has recently poured into the NASDAQ may become “at-risk” if another deeper downside price move takes place. Investors may have hard stops in place and forced selling may take place if the markets attempt to establish a deeper price bottom in the near future.
Conservatively, an upside price move in QID to levels near $27 (45%) is the first Fibonacci target. Further upside target levels near $30.50, $42.50 and $44.25 also exist. Of course, these higher target levels would be the result of a much deeper global market collapse where a deeper bottom in price is established.
Concluding Thoughts:
We believe these three symbols present very real opportunities for skilled technical traders. Wait for the right setup and confirmation before jumping into these trades. If the US and global markets begin to move lower on poor earnings or economic data, jump over to these charts to see how they are reacting to price weakness. There is a very real opportunity for 20~40+% profits in each of these charts with the right setup in place.
As a technical analyst and trader since 1997, I have been through a few bull/bear market cycles in stocks and commodities. I believe I have a good pulse on the market and timing key turning points for investing and short-term swing traders. 2020 is going to be an incredible year for skilled traders. Don’t miss all the incredible moves and trade setups.
I hope you found this informative, and if you would like to get a pre-market video every day before the opening bell, along with my trade alerts visit my Active ETF Trading Newsletter.
We all have trading accounts, and while our trading accounts are important, what is even more important are our long-term investment and retirement accounts. Why? Because they are, in most cases, our largest store of wealth other than our homes, and if they are not protected during a time like this, you could lose 25-50% or more of your entire net worth. The good news is we can preserve and even grow our long term capital when things get ugly like they are now and ill show you how and one of the best trades is one your financial advisor will never let you do because they do not make money from the trade/position.
If you have any type of retirement account and are looking for signals when to own equities, bonds, or cash, be sure to become a member of my Long-Term Investing Signals which we issued a new signal for subscribers.
Ride my coattails as I navigate these financial markets and build wealth while others lose nearly everything they own during the next financial crisis.
Chris Vermeulen
www.TheTechnicalTraders.com
Chris Vermeulen has been involved in the markets since 1997 and is the founder of Technical Traders Ltd. He is an internationally recognized technical analyst, trader, and is the author of the book: 7 Steps to Win With Logic
Through years of research, trading and helping individual traders around the world. He learned that many traders have great trading ideas, but they lack one thing, they struggle to execute trades in a systematic way for consistent results. Chris helps educate traders with a three-hour video course that can change your trading results for the better.
His mission is to help his clients boost their trading performance while reducing market exposure and portfolio volatility.
He is a regular speaker on HoweStreet.com, and the FinancialSurvivorNetwork radio shows. Chris was also featured on the cover of AmalgaTrader Magazine, and contributes articles to several leading financial hubs like MarketOracle.co.uk
Disclaimer: Nothing in this report should be construed as a solicitation to buy or sell any securities mentioned. Technical Traders Ltd., its owners and the author of this report are not registered broker-dealers or financial advisors. Before investing in any securities, you should consult with your financial advisor and a registered broker-dealer. Never make an investment based solely on what you read in an online or printed report, including this report, especially if the investment involves a small, thinly-traded company that isn’t well known. Technical Traders Ltd. and the author of this report has been paid by Cardiff Energy Corp. In addition, the author owns shares of Cardiff Energy Corp. and would also benefit from volume and price appreciation of its stock. The information provided here within should not be construed as a financial analysis but rather as an advertisement. The author’s views and opinions regarding the companies featured in reports are his own views and are based on information that he has researched independently and has received, which the author assumes to be reliable. Technical Traders Ltd. and the author of this report do not guarantee the accuracy, completeness, or usefulness of any content of this report, nor its fitness for any particular purpose. Lastly, the author does not guarantee that any of the companies mentioned in the reports will perform as expected, and any comparisons made to other companies may not be valid or come into effect.
Chris Vermeulen Archive |
© 2005-2022 http://www.MarketOracle.co.uk - The Market Oracle is a FREE Daily Financial Markets Analysis & Forecasting online publication.