


Fibonacci AI Trading System Forecasts Future Gold, Silver & Stock prices
Stock-Markets / Financial Markets 2020 Apr 15, 2020 - 11:08 AM GMTBy: Chris_Vermeulen

As we’ve attempted to illustrate the intuitive nature of the Adaptive Fibonacci Price Modeling system we as one of the tools to help us understand the markets and price setups, we now want to more clearly illustrate other components of the current global economic environment. We want to illustrate just how deep the current price move resonates against historical price norms.
In Part I of this article, we highlighted the Fibonacci system running on the ES (S&P 500) charts. The point of this example was to show that a new price low had already been established and a recent new price high (the all-time high peak) was now acting as a critical price peak. This suggests we are in the process of establishing a much deeper price low (bottom) that may come over the next few weeks as price attempts to “revalue” current economic expectations.
In Part II of this article, we highlighted the Fibonacci Price Theory concepts and attempted to teach you how to identify major and minor Fibonacci price pivot points. This was done to help you understand what we are attempting to share with you and to help you learn to use these techniques in the future. The conclusion of that, Part II, shared our expectations that a new, deeper low, would likely set up in the ES and NQ markets as price attempts to establish a future bottom setup.
In Part III of this article, we shared with you the NQ (Nasdaq) Fibonacci price analysis which was similar to the ES charts. We are attempting to share with you the reality that price will setup intermediate high and low price pivots over time. But we are really trying to explain how the major price pivots have now set up as a massive warning that a deeper low may be targeted as long as price fails to recover to levels near the all-time highs. As “obvious” as that may seem to you now, many traders are already entering the markets expecting a recovery similar to May 2018 or January 2019 to begin. We urge you to reconsider the scope of this disruption of the global economy.
Before we continue, be sure to opt-in to our free market trend signals before closing this page, so you don’t miss our next special report!
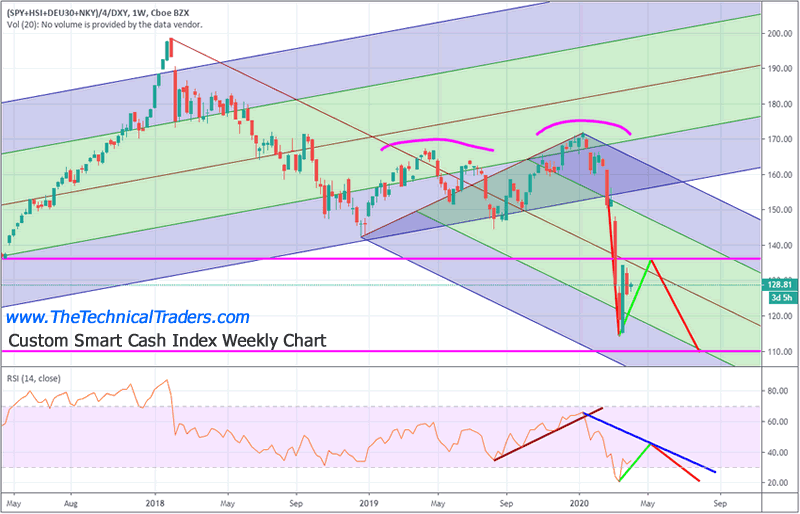
Weekly chart of our Custom Smart Cash Index
The first chart we want to share with you is a Weekly chart of our Custom Smart Cash Index. This chart clearly illustrates just how destructive the recent collapse in the global economy has been. Previous downside price rotations (Feb 2018 & October~December 2018) prompted downside price moves that stayed within the upward sloping price channel established from the 2015~2016 price range setup.
We believe this new downside price cycle will establish a new support channel for future price growth that may include a transition away from traditional economic measures. Essentially, a “new normal” related to debt and economic expectations.
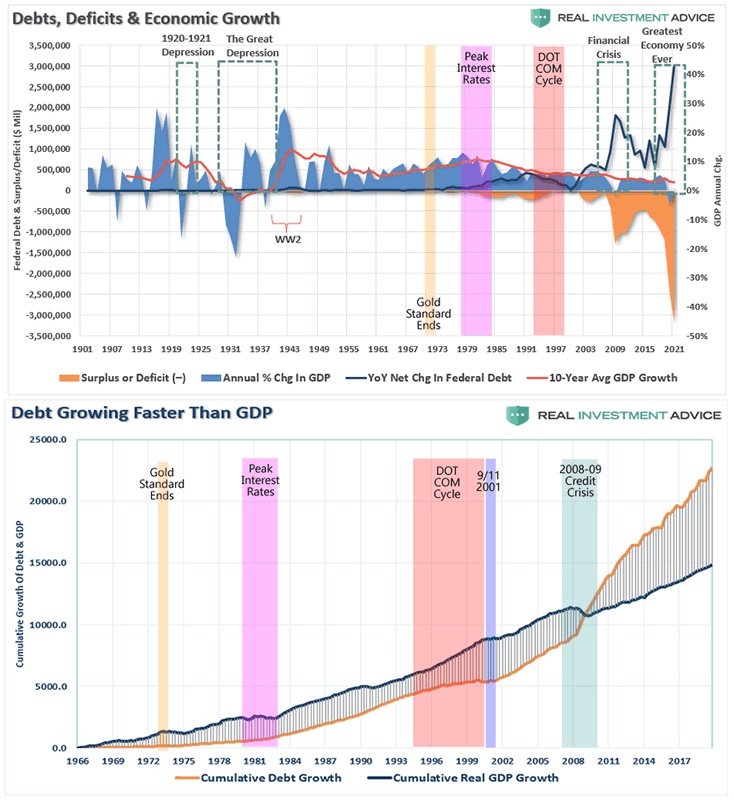
We believe this COVID-19 virus event may be unwinding a large portion of capital appreciation that originated back in 2000~2002 – after the DOT COM and 9/11 Terrorist attacks in NY. Since that time, the US Fed and global central banks have engaged in a series of QE experiments designed to spark economic activity. We believe the core element of the current COVID-19 economic contagion is not related to the central bank’s inability to print more money to throw at the problems in the markets. The problem exists that a healthy market must remove risky debt/credit issues and unhealthy deficits in order to sustain real forward growth opportunities. See this ZeroHedge article for a clear example of what we are attempting to explain: www.zerohedge.com
Looking at some of the charts from the ZeroHedge article, it becomes clear that real economic growth (in relation to proper debt expansion and economic function) likely completed a transitional cycle end near 1999~2002. This came after the US Fed reached peak interest rate levels in the early 1980s and began a deficit spending binge that continues till today. As credit/debt became the new norm, we can see how the expansion of credit created a broader expansion of capital valuation levels (global stock market prices) and provided for an expansion of derivatives and global shadow banking operations. Debt begot more debt/credit – which begot more debt/credit. And the cycle continues until it breaks.
We believe the unwinding process of the global credit market is really just beginning. The COVID-19 virus event was just the catalyst for this event. The virus event prompted a collapse in the global economy because of the global economic shutdown that took place to prevent the spread of the virus. This shutdown strained the global economic/credit market and continues to do so today, by exposing many at-risk companies and business enterprises that were operating on the “fringe” – that space where lack of consumer engagement creates a void in income while debt levels continue to plague future operations. We believe this process of UN-leveraging debt will continue until the markets decide a suitable amount of risk has been removed from the markets. This is when global economic expansion and growth will begin to take hold.
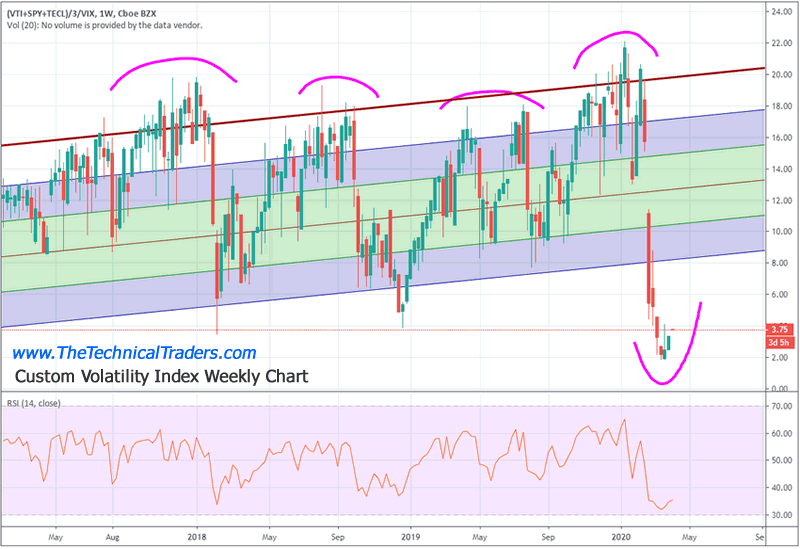
Weekly Custom Volatility Index – Deleveraging Is The New Normal
This Weekly Custom Volatility Index highlights the potential for a “new normal” range as the recent deep low levels on this chart suggests a “deleveraging” process is currently taking place. Even as the US Fed and global central banks pour trillions into the markets, this Custom Volatility Index continues to suggest deleveraging is still ongoing throughout the global markets. Our research team believes the US Fed and global central banks are simply sucking up the immediate risk “froth” in the global markets while the “real meat” of the issue still persists.
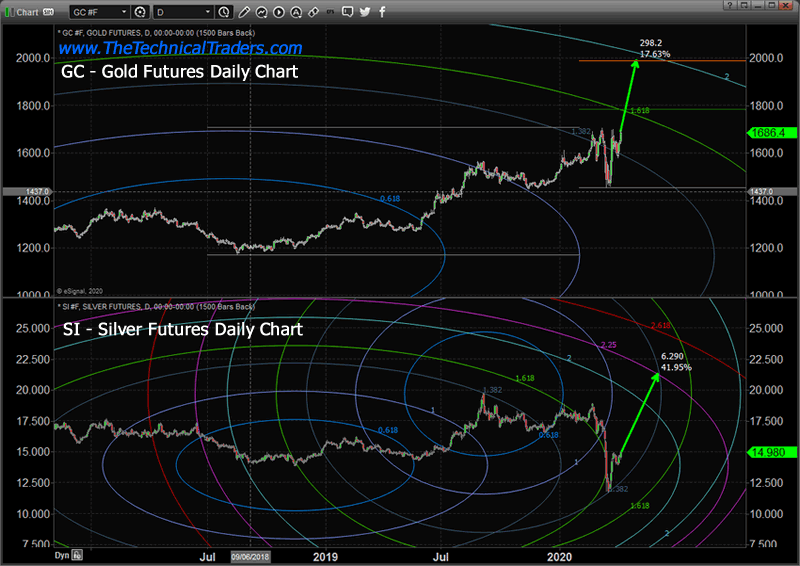
Precious Metals Analysis Points To Higher Prices Long Term
This analysis leads us to Precious Metals – yes, we know, everyone is talking about Gold and Silver right now. Yet, the real reason we are talking about Gold and Silver is because we believe the current economic environment will present an incredible (once in a lifetime) opportunity for skilled traders. Once you truly understand the process that is taking place throughout the globe and how debt/credit expansion over the past 45+ years has propelled the capital markets to massive highs while the metals market has been ignored.
Recently, Gold has rallied to a 6+ year high and Silver is still trading near multi-year lows. The reality is that the global stock market is about to experience a credit/debt revaluation event that is unlike anything we’ve seen since 1929 and/or WWII. Precious metals are about to enter a phase that has never been experienced in recent history. What happens to safe-havens throughout the process of a global market credit/debt crisis event? What happens to metals as the global economy attempts to wash-away excessive debt, derivatives and shadow banking risks that have built up over the past 40+ years?
Concluding Thoughts:
If we are correct and our Fibonacci price modeling systems are correct, a deeper price low in the global markets is about to set up that will attempt to force a “wash-out” event in the global credit/debt markets. This process will likely send precious metals skyrocketing higher. The unknowns of this process are the same unknowns that happened after 1929 & WWII – what will the new financial functions and societal structure be composed of? Until that side of the future becomes more clear, expect a number of unknown factors to continue to drive excessive volatility and risk in the global markets.
As a technical analyst and trader since 1997, I have been through a few bull/bear market cycles in stocks and commodities. I believe I have a good pulse on the market and timing key turning points for investing and short-term swing traders. 2020 is going to be an incredible year for skilled traders. Don’t miss all the incredible moves and trade setups.
I hope you found this informative, and if you would like to get a pre-market video every day before the opening bell, along with my trade alerts visit my Active ETF Trading Newsletter.
We all have trading accounts, and while our trading accounts are important, what is even more important are our long-term investment and retirement accounts. Why? Because they are, in most cases, our largest store of wealth other than our homes, and if they are not protected during a time like this, you could lose 25-50% or more of your entire net worth. The good news is we can preserve and even grow our long term capital when things get ugly like they are now and ill show you how and one of the best trades is one your financial advisor will never let you do because they do not make money from the trade/position.
If you have any type of retirement account and are looking for signals when to own equities, bonds, or cash, be sure to become a member of my Long-Term Investing Signals which we issued a new signal for subscribers.
Ride my coattails as I navigate these financial markets and build wealth while others lose nearly everything they own during the next financial crisis.
Chris Vermeulen
www.TheTechnicalTraders.com
Chris Vermeulen has been involved in the markets since 1997 and is the founder of Technical Traders Ltd. He is an internationally recognized technical analyst, trader, and is the author of the book: 7 Steps to Win With Logic
Through years of research, trading and helping individual traders around the world. He learned that many traders have great trading ideas, but they lack one thing, they struggle to execute trades in a systematic way for consistent results. Chris helps educate traders with a three-hour video course that can change your trading results for the better.
His mission is to help his clients boost their trading performance while reducing market exposure and portfolio volatility.
He is a regular speaker on HoweStreet.com, and the FinancialSurvivorNetwork radio shows. Chris was also featured on the cover of AmalgaTrader Magazine, and contributes articles to several leading financial hubs like MarketOracle.co.uk
Disclaimer: Nothing in this report should be construed as a solicitation to buy or sell any securities mentioned. Technical Traders Ltd., its owners and the author of this report are not registered broker-dealers or financial advisors. Before investing in any securities, you should consult with your financial advisor and a registered broker-dealer. Never make an investment based solely on what you read in an online or printed report, including this report, especially if the investment involves a small, thinly-traded company that isn’t well known. Technical Traders Ltd. and the author of this report has been paid by Cardiff Energy Corp. In addition, the author owns shares of Cardiff Energy Corp. and would also benefit from volume and price appreciation of its stock. The information provided here within should not be construed as a financial analysis but rather as an advertisement. The author’s views and opinions regarding the companies featured in reports are his own views and are based on information that he has researched independently and has received, which the author assumes to be reliable. Technical Traders Ltd. and the author of this report do not guarantee the accuracy, completeness, or usefulness of any content of this report, nor its fitness for any particular purpose. Lastly, the author does not guarantee that any of the companies mentioned in the reports will perform as expected, and any comparisons made to other companies may not be valid or come into effect.
Chris Vermeulen Archive |
© 2005-2022 http://www.MarketOracle.co.uk - The Market Oracle is a FREE Daily Financial Markets Analysis & Forecasting online publication.