Are Coronavirus Death Statistics Exaggerated? Worse than Seasonal Flu or Not?
Politics / Pandemic Apr 13, 2020 - 04:23 PM GMTBy: Nadeem_Walayat
This is part 1 of 2 that updates the current trend trajectories for the coronavirus mega-trend, where whilst the pandemic itself may not last more than a year nevertheless the magnitude of which is likely to impact many aspects of our lives for decades to come. Where the purpose of this analysis is to ensure that we are not all getting carried away by media headlines that could be over exaggerating covid-19 that has resulted in unprecedented government measures. Especially as a significant percentage of people, usually those yet to experience the first hand consequences of the Coronavirus, see it largely in terms of being a corona hoax, fake news, a grab for power, a plandemic, the elites once more playing their power games to enrich themselves just as they did during the financial crisis.
Part 2 will first be made available to Patrons who support my work. So for immediate first access to ALL of my analysis and trend forecasts then do consider becoming a Patron by supporting my work for just $3 per month. https://www.patreon.com/Nadeem_Walayat.
So, whilst the trend trajectory forecasts to date have proven useful in warning well ahead of time of potentially catastrophic consequences for the UK and the US, and where the UK is concerned even before it's first corona death! Nevertheless, as can happen with bull and bear markets that one can get carried away by prevailing sentiment, where today's extreme pessimism has flipped near 180' from that of barely a month ago. Where those in the media and politics today who issue the loudest hysterical warnings were underplaying it's consequences barely a month ago. Now the loudest calls are for flattening the curve, as every one peers over similar logarithmic charts, many for probably the first time. Even though in technical terms such charts are not that useful towards making accurate projections.
So is Covid-19 for real or is it over hyped and in reality little worse than Seasonal Flu?
From those skeptical of the coronavirus the argument goes that those who are being reported as dying of coronavirus would have died anyway of something else, for instance the flu kills 650,000 people per annum, far higher than the 100,000 or so who have died as a consequence of Covid-19. In the UK the flu usually kills about 17,000 people, so currently near double the number of Corona deaths to date. Whilst the CDC estimates 12,000 to 60,000 US deaths against covid deaths of about 18,000. So given the current tallies those skeptical of the coronavirus can make convincing arguments for it being over hyped and that there are ulterior motives at work for the economically costly lockdown's, ranging from trying to control peoples actions to big pharma profiting from mass vaccinations.
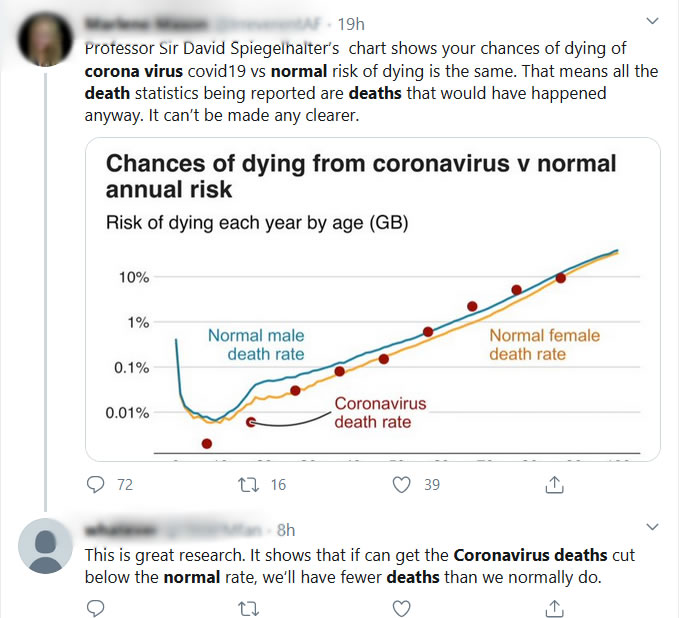
And here are a few comments to illustrate the skeptical views -
What is going to take for you to grasp this covid-19 is all misinformation bullshit to mask the trillions being stolen for the 2nd time. Your on lockdown because you'll riot when you finally figure what going on.
Coronavirus is no more or even LESS deadly than the flu
At 8400 deaths, COVID-14 would be, by far, the least deadly flu season in the past 10 years. That is assuming we actually have 8400 deaths FROM Coronavirus, which I sincerely doubt.
I don't comprehend why we insist on counting a COVID-19 death as "more dead" than a flu death.
Of course the flaw in the "not worse than the flu" argument is that the flu season runs for 7 months, whilst Covid death data being used barely covers 3 weeks! So here's how America's annual flu season deaths compare against the Coronavirus.
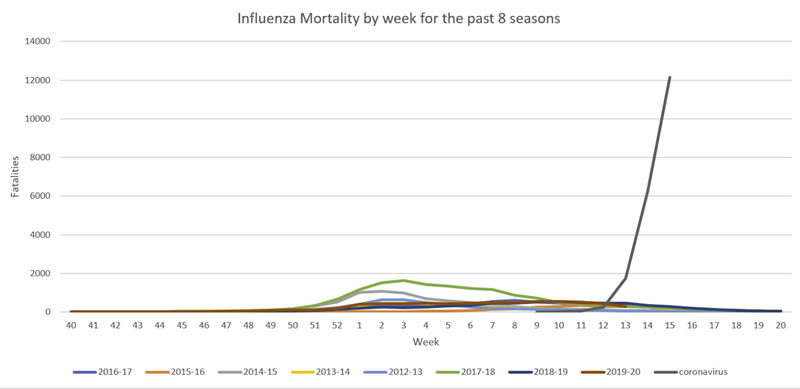
(National centre for health statistics)
US annual Flu deaths average at 61,000 per year (46,000-95,000). The largest death toll was Week 3 of 2018 with 1,625 deaths. If one totaled the maximum weekly deaths of ALL 8 years of data then this total would be about 6,500 flu deaths for one week (i.e. adding up 8 years of max weekly flu deaths). Which is set against the US this past week experiencing 11,626 reported Covid19 deaths, implying that covid is currently operating at a death rate that of 14 times that of the flu.
Here's another chart of daily US deaths upto the 4th of April that shows that even at that stage Coronavirus deaths were several orders of magnitude greater than the flu.
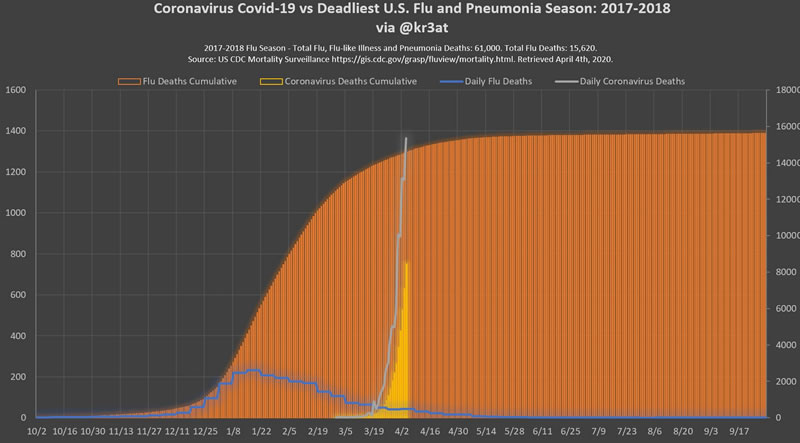
So the error here whether deliberate or not is that when comparing the flu to covid19 is by comparing a 7 month flu season against 3 weeks of the covid deaths, and that the government panic interventions in the form of lockdown's are aimed at greatly curbing the rising death tolls going forward which just does not happen during flu seasons that run for 7 months!
And here's an example of why things have changed so rapidly, where a month ago few took it seriously, whilst today it is highly probable MOST people are taking it very seriously/

Whilst I am sure conspiracy theorists will argue that virtually every death taking place today is being labeled as a consequence of Covid-19 and thus the scary numbers being broadcast each day. Therefore in the interests of understanding what is actually taking place then to test whether the danger of Covid19 is real or exaggerated i.e. that the people who are dying would have died anyway of something else then the answer to this question will be in the weekly total number of registered deaths data. Where if Coronavirus is mostly hype then the total number of weekly deaths should not vary significantly above normal expectations based on averages of recent years, which is thus the focus of this analysis.
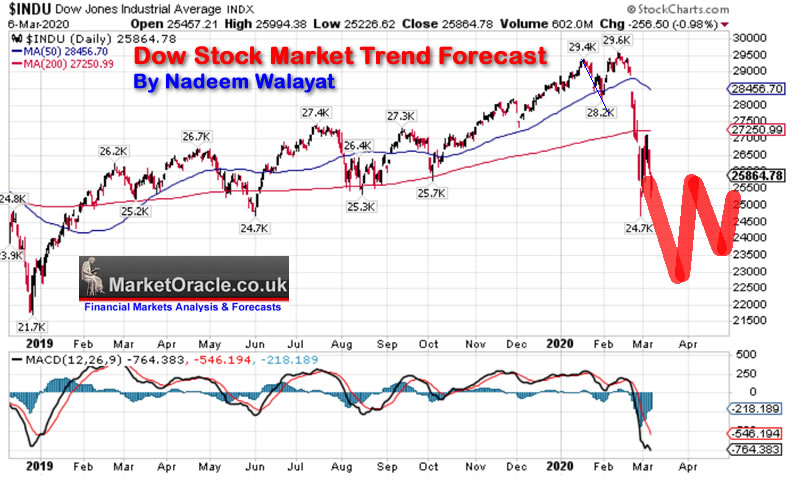
Against this my analysis of approaching the past 3 months (since 28th Jan) has pushed me firmly towards the risks of Coronavirus being REAL and thus the implications of which were to expect a stocks bear market and economic contraction as being the most probable outcome that has come to pass, that and giving investors a golden opportunity to buy AI stock Mid March at prices typically 33% off their January highs for AI sector mega-trend stocks. That further went on to expect the coronavirus stocks bear market to bottom before the end of March, as my forecast graph of early March illustrates.
However, I do in part agree with the conspiracy theorists to some extent for differing reasons in that after ignoring the pandemic for the whole of February and early March the the mainstream establishment swing in the opposite direction and has gone from coronavirus being of little consequences to an armageddon event, with projected death tolls for the the UK and US running into the millions! (UK 1.4 million, US 2.2 million) IF the lockdown's had not been implemented.
Where even if my forecasts for the UK and US (last updated 6th April) do turn out to be significant under estimates nevertheless the actual number of deaths is going to be nowhere near official projections of 200,000 for the UK (recently revised down to 20k) and 100k to 250k for the US.
However, unlike the conspiracy theorists who bandy about made up figures that the number of deaths in the UK and US are NOT abnormal and thus Covid-19 is a fake plandemic. I really do want to know the answer to this question for which obviously we have had to wait for the deaths to be registered and show up in the official statistics.
For the UK the answer lies with the Office of National Statistics (ONS) weekly figures of the number of deaths registered in the UK, where if Covid-19 was resulting in a lot of extra deaths than we should see a SPIKE in the number of deaths registered.
The latest data published is for the week ending 27th March, with data for the Week ending 4th April expected to be published on the 14th of April (tomorrow).
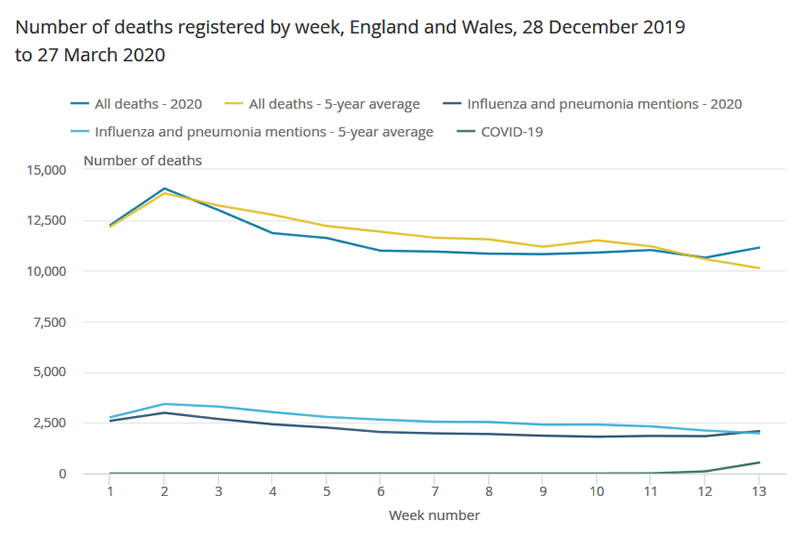
The ONS lists the total number of registered deaths in England and Wales set against the 5 year average, which have been further broken down by Flu and Covid deaths.
Analysis of the data shows that total deals are 10% higher than the seasonal average, whilst flu deaths are also up by 5% against the 5 year average, so at the very least flu deaths are not being labeled as covid-19 deaths.
However if you take the flu deaths out of the equation then there were 904 more deaths then the seasonal trend of which 539 were registered as covid-19, against 582 for the UK as a whole for the same period. Thus 365 deaths that could also be covid-19 deaths in the community were not tested for covid which implies the covid death toll could be as much as 60% higher than reported

However, a 10% increase in the total number of weekly deaths whilst significant is not something that would warrant the blind panic of total lockdown. Though of course this data is just for week 2 of when the number of covid deaths first exceeded 100.
So Tuesdays data (unless it is delayed) 'should' prove definitive in whether the broadcast Covid-19 death numbers are real or exaggerated. Where my following table for the week ending 3th April for which there were 3554 reported Covid deaths in the UK, 90% of which were in England. However against this anywhere from 25% to 60% of deaths are in the community which are not being counted as Covid-19 deaths in the official Public Health England statistics.

Therefore I am expecting the number of deaths reported by the ONS for England to be at least 40% higher than the average of recent years. Where for every percentage below that number then the less significant Coronavirus actually is and where for every % above that level the greater is the significance and danger of Covid-19!
Furthermore, given that there is a lag of between 3-5 weeks between the impact of the lockdown's and the number of deaths then the trend trajectory for the week ending 10th April is to expect to result in an even greater percentage increase in the total number of weekly deaths by at least 60% above normal.

And it is also possible that before we pass the peak that the number of weekly deaths hits double the usual number of weekly deaths.
So I am expecting every Tuesday's ONS data release for the next few weeks to grab media headlines, as the number of registered deaths keeps increasing way beyond seasonal norms as harbingers of what would have transpired had the government not locked down Britain after being negligent in containing the pandemic. It also illustrates that the average persons obsession with wanting to thank the NHS is largely misguided as Britain's healthcare system is likely the worst in Western Europe which will be revealed much later when comparisons are made between what each EU nation suffered at the hands of the Wuhan flu! And this despite the UK having had ADVANCE WARNING of what was coming!
At some point I will will look at conducting a similar exercise for the US, though I still expect the US to follow a better trend trajectory than the UK, for the United States has had advance warning on top of an advance warning so has NO excuses for doing worse!
My next analysis will update the UK and US trend trajectories and stock market implications thereof, and update AI stocks buying levels for Q2, to be posted soon after release of Tuesday's ONS data that will first be made available to Patrons who support my work. So for immediate first access to ALL of my analysis and trend forecasts then do consider becoming a Patron by supporting my work for just $3 per month. https://www.patreon.com/Nadeem_Walayat.
And ensure you are subscribed to my ALWAYS FREE newsletter for my next in-depth analysis.
Your Analyst
Nadeem Walayat
Copyright © 2005-2020 Marketoracle.co.uk (Market Oracle Ltd). All rights reserved.
Nadeem Walayat has over 30 years experience of trading derivatives, portfolio management and analysing the financial markets, including one of few who both anticipated and Beat the 1987 Crash. Nadeem's forward looking analysis focuses on UK inflation, economy, interest rates and housing market. He is the author of five ebook's in the The Inflation Mega-Trend and Stocks Stealth Bull Market series that can be downloaded for Free.
 Nadeem is the Editor of The Market Oracle, a FREE Daily Financial Markets Analysis & Forecasting online publication that presents in-depth analysis from over 1000 experienced analysts on a range of views of the probable direction of the financial markets, thus enabling our readers to arrive at an informed opinion on future market direction. http://www.marketoracle.co.uk
Disclaimer: The above is a matter of opinion provided for general information purposes only and is not intended as investment advice. Information and analysis above are derived from sources and utilising methods believed to be reliable, but we cannot accept responsibility for any trading losses you may incur as a result of this analysis. Individuals should consult with their personal financial advisors before engaging in any trading activities.
Nadeem Walayat Archive |
© 2005-2022 http://www.MarketOracle.co.uk - The Market Oracle is a FREE Daily Financial Markets Analysis & Forecasting online publication.


