The US Dollar Index: How Can it Help You Trading?
Currencies / US Dollar Apr 04, 2020 - 06:24 PM GMTBy: Submissions
Luckily, there are various ways to optimize your trading besides technical and fundamental analysis, especially when it comes to forex trading. Chances are that you are currently thinking about the live forex rates, however, there is an even more powerful tool to take advantage of the US dollar Index.
What is the US Dollar Index?
The US Dollar Index is indeed a very useful tool to leverage in your trading as it can act as confirmation for your assumption regarding the upcoming price movement of a specific currency pair you are trading. Either it warns you of storms of the horizon or it gives green light to your trading ideas. Definitely, it hints whether a currency pair is likely to move towards the up/- or downside.
With the privately held Federal Reserve being the most important central bank in the world, the US dollar is the most frequently traded currency in the world, covering more than 70 percent of all transactions globally. Thus, keeping an eye on the US dollar can be very advantageous and that’s when the US dollar index comes into play.
The US Dollar Index (USDX) shows the value of the US dollar in comparison to the major six currencies. Introduced in the year 1973, its value was set at 100 and since then, it is traded as a futures contract at the US ICE futures exchange. The US Dollar Index compares a weighted average of the US dollar with the euro (EUR), Japanese yen (JPY), British pound (GBP), Canadian dollar (CAD), Swedish Crown (SEK) and the Swiss franc (CHF).
Of course, the currencies are weighted differently, and therefore, are calculated like that:
50.14348112 x ((EUR ^ 0,576) x (JPY ^ 0.136) x (GBP ^ 0.119) x (CAD ^ 0.091) x (SEK ^ 0.042) x (CHF ^ 0.036))
Historical Development
So how can it help you trading? You can see if the US dollar is strong or weak compared to the major currencies. Consequently, if the value of the index rises, the US dollar is considered rather strong compared to the other major currencies. If the US dollar index loses in value, it signals a weakness of the US dollar against the other main currencies.

source: https://www.macrotrends.net/1329/us-dollar-index-historical-chart
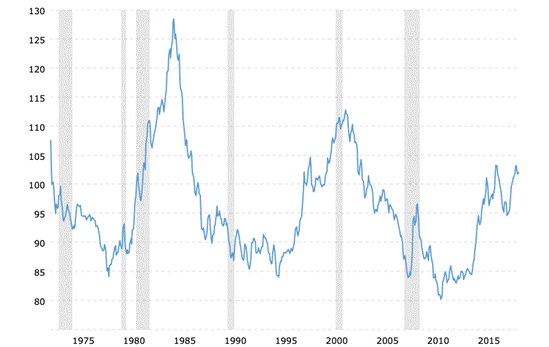
In the example above you can see the price development of the US dollar index in 43 years. Interestingly enough, you can see the bursting of the commodities bubble in 1980. What’s more, the US dollar had been forming a bottom and then doubled its value within the ensuing period of five years. Between 1984 and 1995 the US Dollar Index declined sharply which is a sign of weakness. After that, it gained significantly again and peaked around 2001 and dropped down to its prior low at around 85 in 2007. After the 2008 housing bubble, the global financial crisis intensified which brought the index near the 90-point-level within a few months. As a consequence, it was followed by a long consolidation until late 2014, where the index finally started heading up again.
The USDX is the Anti-Euro Index

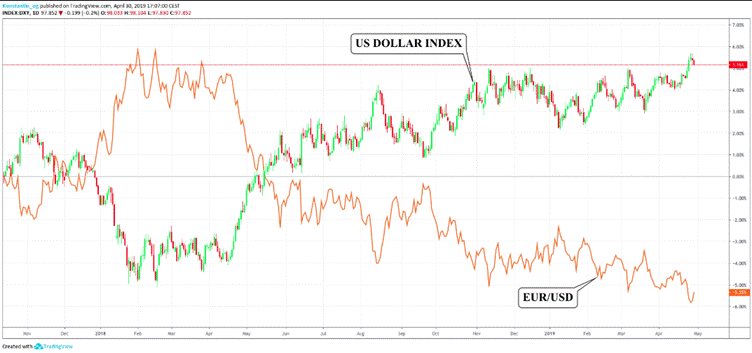
There is an adverse correlation between the US dollar index and the EUR/USD currency pair. In fact, it shows a very strong correlation and they are moving in opposite directions.
Conclusion
The key takeaways are:
• The US dollar index and USD/X currency pairs typically move in the same direction.
•the US dollar index and X/USD currency pairs typically move in opposite directions.
By Ryan Stein
© 2020 Copyright Ryan Stein - All Rights Reserved
Disclaimer: The above is a matter of opinion provided for general information purposes only and is not intended as investment advice. Information and analysis above are derived from sources and utilising methods believed to be reliable, but we cannot accept responsibility for any losses you may incur as a result of this analysis. Individuals should consult with their personal financial advisors.
© 2005-2022 http://www.MarketOracle.co.uk - The Market Oracle is a FREE Daily Financial Markets Analysis & Forecasting online publication.


