


Gold to Silver Ratio Hits 100!
Commodities / Gold & Silver 2020 Mar 11, 2020 - 10:10 AM GMTBy: P_Radomski_CFA

Gold is testing its previous 2020 highs, but silver plunged anyway, which created a very special situation. Namely, the gold to silver ratio just jumped to the 100 level.
This may not seem like a big deal, because ultimately people buy metals, not their ratio, but it actually is a huge deal. This ratio is observed by investors and traders alike, as it tends to peak at the market extremes. Moving to the 100 level might indicate that we are at a price extreme. But what kind of extreme would that be if silver is declining while gold moved up?
Let’s take a closer look at the gold to silver ratio chart for details.
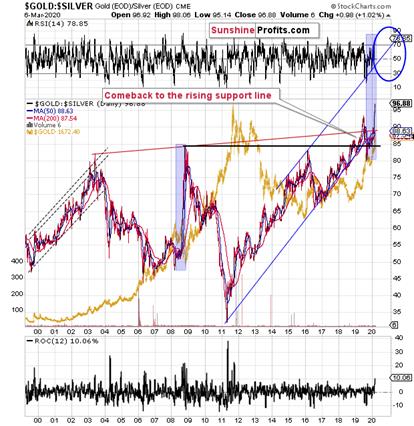
In early July 2019, the gold to silver ratio topped after breaking above the previous highs and now it’s after the verification of this breakout. Despite the sharp pullback, the ratio moved back below the 2008 high only very briefly. It stabilized above the 2008 high shortly thereafter and now it’s moving up once again.
It previously moved up relatively slowly, but it jumped to new highs last week and today.
Anything after a breakout is vulnerable to a quick correction to the previously broken levels. On the other hand, anything after a breakout that was already confirmed, is ready to move higher and the risk of another corrective decline is much lower.
The most important thing about the gold and silver ratio chart to keep in mind is that it’s after a breakout above the 2008 high and this breakout was already verified. This means that the ratio is likely to rally further. It’s not likely to decline based on being “high” relative to its historical average. That’s not how breakouts work.
The breakout above the previous highs was verified by a pullback to them and now the ratio moved even higher, just as we’ve been expecting it to.
The true, long-term resistance in the gold to silver ratio is at about 100 level. This level was not yet reached, which means that as long as the trend remains intact (and it does remain intact), the 100 level will continue to be the likely target.
We’ve been writing the above for weeks (hence we formatted it with italics), despite numerous calls for a lower gold to silver ratio from many of our colleagues. And our target of 100 was just hit today. It was only hit on an intraday basis, not in terms of the daily closing prices, but it’s still notable.
We had been expecting the gold to silver ratio to hit this extreme close or at the very bottom and the end of the medium-term decline in the precious metals sector – similarly to what happened in 2008. Obviously, that’s not what happened.
Instead, the ratio moved to 100 in the situation where gold rallied, likely based on its safe-haven status, and silver plunged based on its industrial uses.
Despite numerous similarities to 2008, the ratio didn’t rally as much as it did back then. If the decline in the PMs is just starting – and that does appear to be the case – then the very strong long-term resistance of 100 might not be able to trigger a rebound.
It might also be the case that for some time gold declines faster than silver, which would make the ratio move back down from the 100 level. The 100 level could then be re-tested at the final bottom.
Or… which seems more realistic, silver and mining stocks could slide to the level that we originally expected them to while gold ultimately bottoms higher than at $890. Perhaps even higher than $1,000. With gold at $1,100 or so, and silver at about $9, the gold to silver ratio would be a bit over 120.
If the rally in the gold to silver ratio is similar to the one that we saw in 2008, the 118 level or so could really be in the cards. This means that the combination of the above-mentioned price levels would not be out of the question.
At this time, it’s too early to say what combination of price levels will be seen at the final bottom, but we can say that the way gold reacted recently and how it relates to everything else in the world, makes gold likely to decline in the following months. Silver is likely to fall as well and its unlikely that a local top in the gold to silver ratio will prevent further declines.
Thank you for reading the above free analysis. It’s part of today’s extensive Gold & Silver Trading Alert. We encourage you to sign up for our free gold newsletter – as soon as you do, you'll get 7 days of free access to our premium daily Gold & Silver Trading Alerts and you can read the full version of the above analysis right away. Sign up for our free gold newsletter today!
Thank you.
Przemyslaw Radomski, CFA
Founder, Editor-in-chief
Tools for Effective Gold & Silver Investments - SunshineProfits.com
Tools für Effektives Gold- und Silber-Investment - SunshineProfits.DE
* * * * *
About Sunshine Profits
Sunshine Profits enables anyone to forecast market changes with a level of accuracy that was once only available to closed-door institutions. It provides free trial access to its best investment tools (including lists of best gold stocks and best silver stocks), proprietary gold & silver indicators, buy & sell signals, weekly newsletter, and more. Seeing is believing.
Disclaimer
All essays, research and information found above represent analyses and opinions of Przemyslaw Radomski, CFA and Sunshine Profits' associates only. As such, it may prove wrong and be a subject to change without notice. Opinions and analyses were based on data available to authors of respective essays at the time of writing. Although the information provided above is based on careful research and sources that are believed to be accurate, Przemyslaw Radomski, CFA and his associates do not guarantee the accuracy or thoroughness of the data or information reported. The opinions published above are neither an offer nor a recommendation to purchase or sell any securities. Mr. Radomski is not a Registered Securities Advisor. By reading Przemyslaw Radomski's, CFA reports you fully agree that he will not be held responsible or liable for any decisions you make regarding any information provided in these reports. Investing, trading and speculation in any financial markets may involve high risk of loss. Przemyslaw Radomski, CFA, Sunshine Profits' employees and affiliates as well as members of their families may have a short or long position in any securities, including those mentioned in any of the reports or essays, and may make additional purchases and/or sales of those securities without notice.
Przemyslaw Radomski Archive |
© 2005-2022 http://www.MarketOracle.co.uk - The Market Oracle is a FREE Daily Financial Markets Analysis & Forecasting online publication.