


Key Support Levels for the S&P 500, Dow and TSX
Stock-Markets / Stock Markets 2020 Mar 10, 2020 - 05:23 PM GMTBy: Donald_W_Dony

The market sell-off continues to build as many investors believe more downside slippage is coming. Sells in mutual funds and individual stock portfolios, as reported, are reaching highs not seen since 2015.
Yet, many institutions are now positioning trades for the inevitable rebound.
The Commitment of Traders (COT) are showing a build-up of positions at certain key levels.
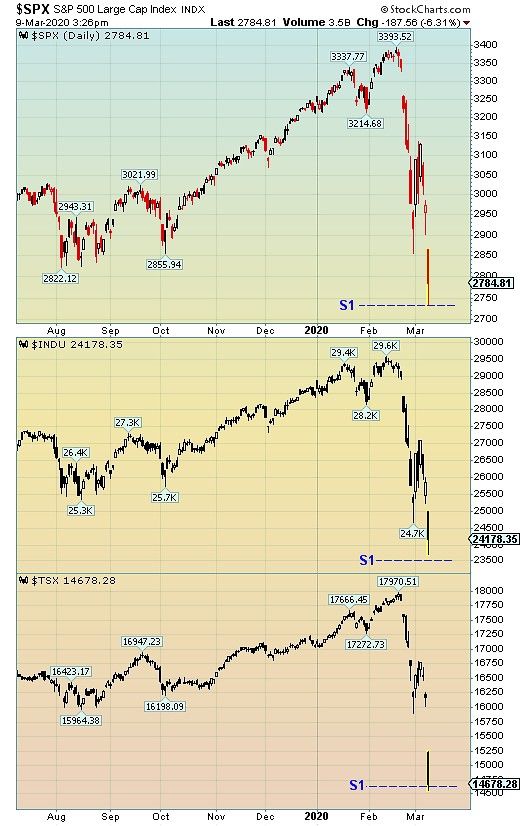
For the S&P 500, 2740 appears to be a mark where positions are being established. For the Dow, 23,500 and for the TSX,14,675 are being tested (Chart 1).
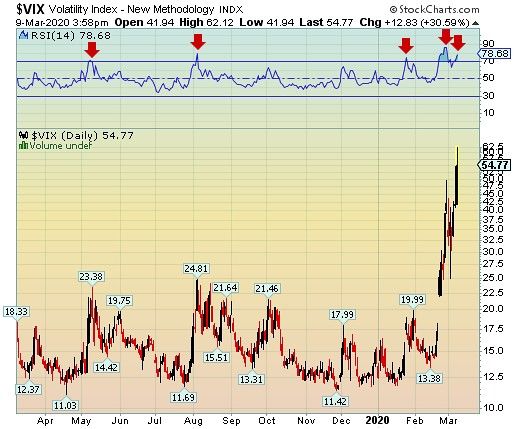
The recent price level of the VIX is also adding evidence to the COT positions.
The Volatility Index (often called the Fear Index), is at a level of 54.77. This is the highest level since late 2008. Buying momentum shows that extreme levels in the VIX (those with red arrows) are usually short-term and reverse as quickly as they have advanced (Chart 2).
Finally, Chart 3 illustrates a 12-year profile of the secular bull market. There is no current evidence of any break in the upward trend. The S&P 500 would need to move to 2600 or lower to violate the present trend. This action would also require a time period of 2-3 weeks below 2600.
Bottom line: The current data from the COT report, the VIX analysis and the 12-year chart of the S&P 500, shows little evidence of the markets preparing for a breach of the secular bull market.
A final note, over the last 130 years, secular bull markets since 1870 have lasted on average 18 years (see page 1 of the July 2019 Technical Speculator). This upward trending market has only advanced for 11 years. There is much more upside to come.
By Donald W. Dony, FCSI, MFTA
www.technicalspeculator.com
COPYRIGHT © 2020 Donald W. Dony
Donald W. Dony, FCSI, MFTA has been in the investment profession for over 20 years, first as a stock broker in the mid 1980's and then as the principal of D. W. Dony and Associates Inc., a financial consulting firm to present. He is the editor and publisher of the Technical Speculator, a monthly international investment newsletter, which specializes in major world equity markets, currencies, bonds and interest rates as well as the precious metals markets.
Donald is also an instructor for the Canadian Securities Institute (CSI). He is often called upon to design technical analysis training programs and to provide teaching to industry professionals on technical analysis at many of Canada's leading brokerage firms. He is a respected specialist in the area of intermarket and cycle analysis and a frequent speaker at investment conferences.
Mr. Dony is a member of the Canadian Society of Technical Analysts (CSTA) and the International Federation of Technical Analysts (IFTA).
Donald W. Dony Archive |
© 2005-2022 http://www.MarketOracle.co.uk - The Market Oracle is a FREE Daily Financial Markets Analysis & Forecasting online publication.