Stock Markets to Fall Another 25% Due to Margin Debt Deleveraging
Stock-Markets / Stocks Bear Market Oct 07, 2008 - 11:14 AM GMTBy: Ashraf_Laidi

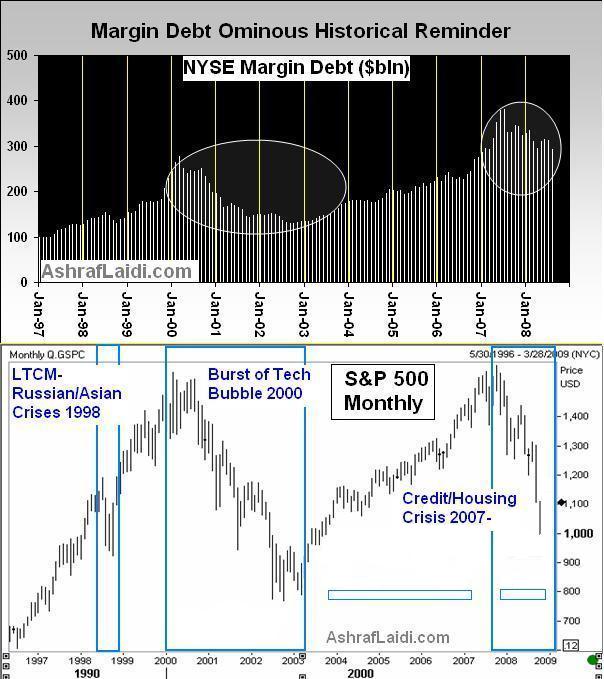
 There is one concrete reason why US indices could lose at least another 20-25% from current levels. The powerful correlation between margin debt usage by member firms of the NY Stock Exchange and the trend of major indices such as the S&P500 and the Dow Jones Industrials Average suggests further selling ahead in the main indices.
The considerable leverage accumulated during the last bull market is now forcefully being undone by a powerful combination of margin calls and accelerating market losses, triggering broad ripples of sell orders among large and small investors. On Jan 25th, 2 days after global markets plunged on the revelation of mounting losses at Societe Generale, we predicted a decline of 15%-25% in US equity indices for H1 2008 and further losses in H2. Amid the many signals in the market and the real economy, we focused on the aggregate margin debt used by member firms of the NY Stock Exchange.

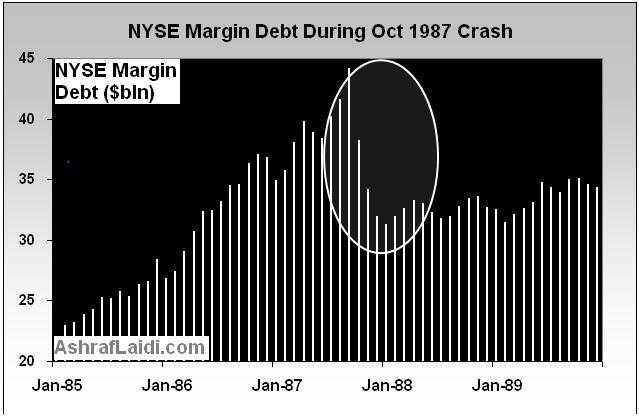
The chart shows that the rapid declines in margin debt from their record highs correctly predicted prolonged losses in the major equity indices in fall 1987, fall 1998 and spring 2000. After attaining a record high of $381 billion in July, NYSE member firms' margin use continued to tumble into the subsequent 4 months, reaching a low of $322 billion. The declines in margin debt resulted from the execution of margin calls as client losses escalate to unsustainable levels--a typical characteristic during surging volatility. The top chart also shows that after recovering in May-July near 300 billion, margin debt fell anew in August, reaching 292 billion--the lowest since March 2007. The bottom chart shows the monthly S&P500, and how it closely reflects the shifts in margin accumulation and disposal.
The relationship has already enabled us to predict 12-15% declines in equities in Q1 2008 (announced to clients in the 2008 preview in December 2007) and in H1 2008. Back then, the rationale was: "We expect another 15-25% of declines to come by end of H1 as the macroeconomic deterioration coupled with prolonged losses in US banks and profit warnings (no currency translation effect this time as the dollar stabilized in Q4-Q1) will overwhelm the easing measures of the Fed."

Today, all major US equity indices are down by more than 30% year-to-date, leading their international counterparts well into bearish territory and ensuring that recession will not only meet its common definition of 2 consecutive quarterly declines, but also that the slowing economy will feed into weaker valuations and earnings compression. And as :place :country-region US stocks lose in 1 year what they gained in nearly 4 years, the corrosion to the wealth effect adds to an already fragile consumer foundation, burdened by negative home equities.
Margin debt accumulation and disposal bolstered our bearish take on the markets in January, allowing us to forecast renewed unwinding in yen carry trades. Looking ahead, we expect USDJPY to fall under the 100 yen level this month for the first time sine March. As long as the Federal Reserve holds out from cutting rates before October 29, markets are likely to maintain their relentless pressure, especially considering the vacuum of good news on the economic and earnings fronts. Additional deleveraging is also expected to weigh on EURUSD towards the $1.3350 territory, while dragging GBPUSD towards $1.7050.
By Ashraf Laidi
CMC Markets NA
AshrafLaidi.com
Ashraf Laidi is the Chief FX Analyst at CMC Markets NA. This publication is intended to be used for information purposes only and does not constitute investment advice. CMC Markets (US) LLC is registered as a Futures Commission Merchant with the Commodity Futures Trading Commission and is a member of the National Futures Association.
Ashraf Laidi Archive |
© 2005-2022 http://www.MarketOracle.co.uk - The Market Oracle is a FREE Daily Financial Markets Analysis & Forecasting online publication.


