Will CoronaVirus Pandemic Trigger Stocks Bear Market 2020?
Stock-Markets / Stock Markets 2020 Feb 28, 2020 - 10:14 AM GMTBy: Nadeem_Walayat
The stock market that had been an state of denial for several weeks has FINALLY woken up to the reality of the CORONAVIRUS PANDEMIC STORM that has triggered a series of waterfall drops this weeks, slicing through technical support levels as though they did not exist, catching most market commentators completely by surprise who had assumed that the virus would remain largely within China's borders. However, my Coronavirus analysis in a series of articles and videos starting late January increasingly warned to expect severe market consequences in response to the unfolding Global Pandemic.
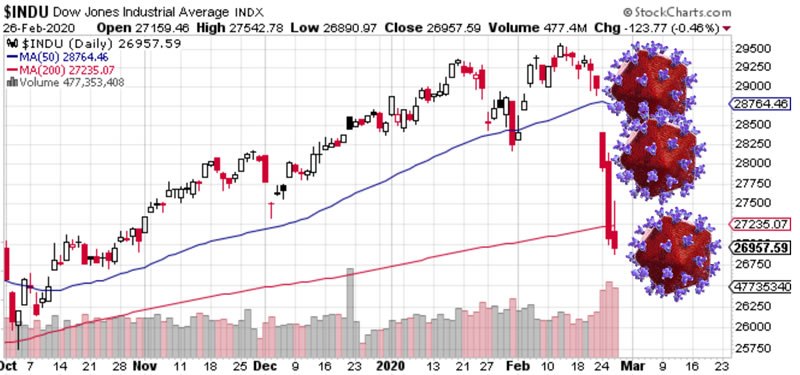
This analysis warned of the increasing probability for a Coronavirus stocks bear market that was first made available to Patrons who support my work. Will CoronaVirus Pandemic Trigger a Stocks Bear Market 2020?. The whole of which now follows below that illustrates that the key driver for the stock market trend for much of 2020 is not going to be fundamental, or technical but rather VIRAL!.
So for immediate first access to ALL of my analysis and trend forecasts then do consider becoming a Patron by supporting my work for just $3 per month. https://www.patreon.com/Nadeem_Walayat.
Whilst my latest analysis in this series are -
27th Feb - The Coronavirus Stocks Bear Market Begins, When Will it End?
22nd Feb Coronavirus Pandemic Stock Market Implications
Will CoronaVirus Pandemic Trigger a Stocks Bear Market 2020?
The stock market is confounding growing Coronavirus fears by recovering all of the late January's drop in the wake of Coronavirus news out of China that started global alarm bells ringing of what could transpire right across the world. The Dow retraced all of its drop from 29400 to 28200 to Thursday's high of 29408, a new all time high! Clearly where the markets are concerned it's a case of virus? What virus? So discounting the Coronavirus as background noise, unlikely to have any significant economic or market events outside of a few cities in China, are the markets wrong?
That and the Democrats busted flush Impeachment of Trump that clearly did not have a hope in hells chances of succeeding given that the Democrats only managed to convince 1 Republican senator (Mick Romney) to vote for Impeachment, so reduced political uncertainties resolves in market calm before the Coronavirus storm? Find out as I chart the prospects for the Dow's trend over the next couple of months.
Parabolic Coronavirus Pandemic
The Coronavirus is more a looming black cloud over the global economy than a black swan event because we all know it's out there in China trying to breakout across the world but so far failing to do so, where in my opinion this is lulling the world including the financial markets into a false sense of security.
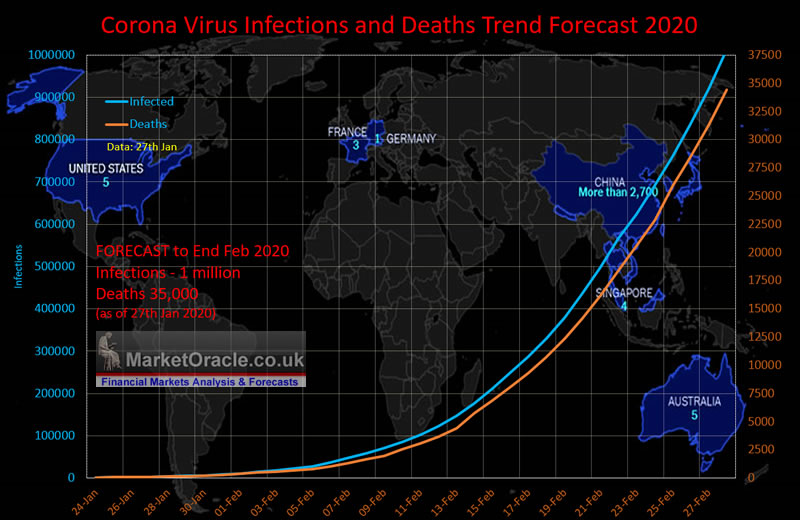
Why ? Because China is now passing Day 60 of the outbreak! And as per my trend forecast of 28th January, the pandemic has yet to really start taking off in terms of infections and deaths, where I literally expect it to go parabolic towards the end of February. My analysis of 28th Jan concluded in forecast expectations for the virus to target 1 million infections by the end of February resulting in 35,000 deaths based on the then implied mortality rate of 3.5%.
Forecast youtube Video : https://youtu.be/c1rXvXMD3jc
Latest youtube video update as of Pandemic Day 57.
The graph illustrates that the trend trajectory forecast infections to only really start taking off globally mid February when the number of officially declared infections are expected to exceed 100,000 and deaths 2,500. So we are still about a week away from when the Coronavirus pandemic really starts to take off globally, and by the end of February starts to overwhelm healthcare systems which is the real reason why the number of deaths will start to increase.
Coronavirus Infection Spread Day 60.
The forecast for the number of infections and deaths by 6th of Feb 2020 vs actual:
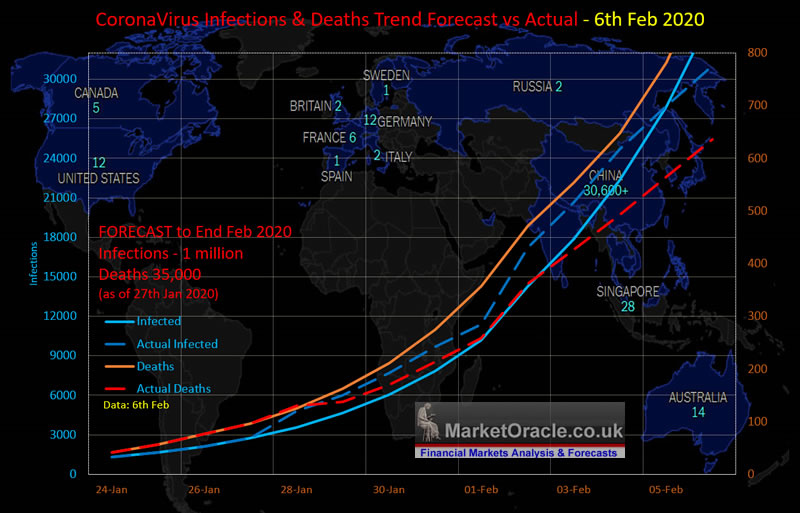
The forecast for the number of infections and deaths by 6th of Feb 2020 vs actual:
| Infections | Deaths | |
| Forecast for 6th Feb | 34899 | 977 |
| Actual - 6th Feb | 31000 | 636 |
| % Diff | 88% | 65% |
Were this trend to continue into the end of February 2020 then the number of infected would total 888,000, whilst the number of deaths would total 18,233. So the latest data implies a wider spread but a lower mortality rate of about 2.1%.
However, there are 2 points to consider, firstly that China is UNDER REPORTING the number of infections and likely deaths. Which means that I still expect the actual pool of infected to pass 1 million by the end of February and thus the risks of a global pandemic remain extremely high.
And that there are large susceptible populations with poor healthcare infrastructure such as India that announced it's first infection a week ago where outbreaks could quickly overwhelm heathcare systems. Also that a vaccine is still a good 4 months away so far too late to have any impact on this pandemic.
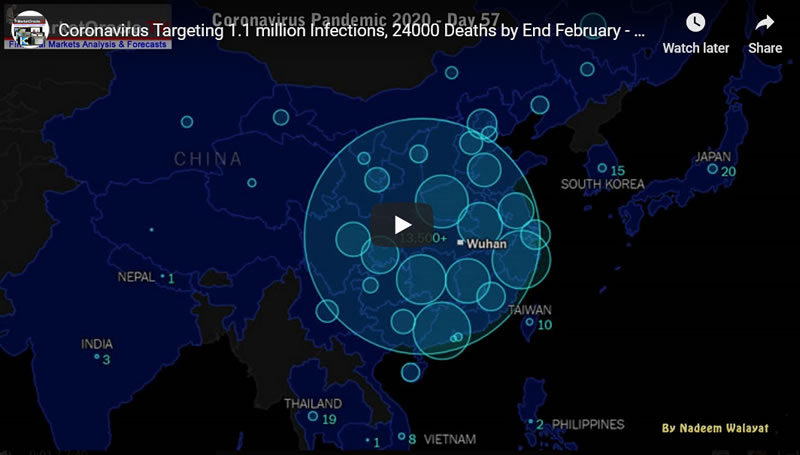
Meanwhile this is what China and Asia's infections map currently looks like, which again in my opinion grossly under estimates the number of infected, hence why even the official numbers are increasing exponentially. If I had to guess at a number, I would say that MORE than 200,000 are infected as of today.

Given the continuing spread of the virus in China and the forecast trend trajectories then the rest of the world is currently still in the calm before the storm stage with likely several outbreaks that risk over whelming healthcare systems as has happened in China. That official figures are under reporting the actual number of infections, for instance as of writing the Diamond Princess cruise ship in Yokohama in Japan has 60 confirmed cases of Coronavirus whilst the total for Japan is still just 45, so likely even for Japan the number of actual cases is double that which is being reported.
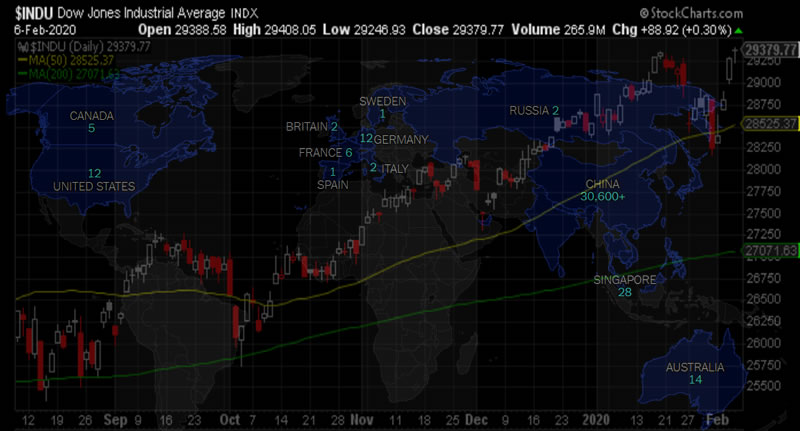
And this is what happens to a stock market by Day 60 of a Coronavirus outbreak in response to Chinese central bank pumping over $200 billion into financial system, so don't be fooled by the artificial bounce in stock prices which is due to buying from state run banks.
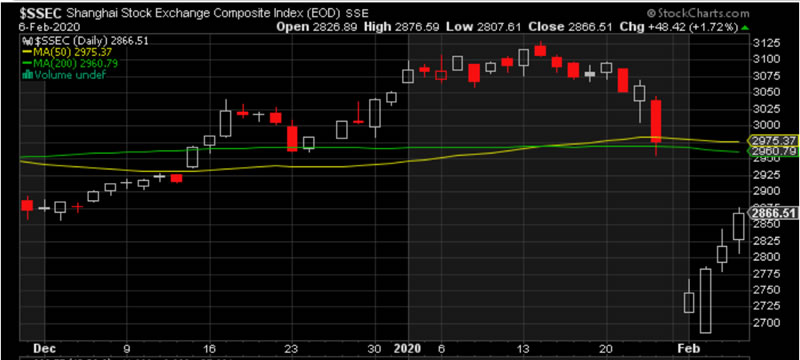
Whilst the rest of the world is barely scraping past Day 10 in terms of infections, where just as was the case with China are lulled into a false sense of security that a rising emerging super power could easily cope with a new flu strain, albeit a little worse than the usual annual flu bug.
Fast forward 60 days and the Worlds No2 economy is being brought to a virtual shutdown and we have not even reached the peak of this crisis yet for China!
The US is perhaps at day 12 of its outbreak whilst the UK is at day 9. So yet to reach the point where it can be expected to have any significant impact on society and the stock market that will likely come much later, probably not until towards the end of February, so most of the world is still in the calm before the Coronavirus storm stage.
Of course, it is possible that more developed, open and robust western healthcare systems are better able to contain outbreaks by acting sooner than the Chinese who by looks of things sat on their hands for a good month thus allowing the virus go on the rampage whilst local party officials and the police silenced warnings from down below such as from Dr Li Wenliang (now deceased).

Which illustrates the flaw at the heart of the Chinese society where a lack of freedom of speech can result in apocalyptic consequences!

So whilst China can claim to be a rising super power, however the flaws at the heart of it's society ensure that it is doomed to fail in it's quest for world dominance where even something as small as flu bug can bring it to it's very knees!
So at this point in time the trend trajectory remains as forecast and no matter how robust healthcare systems are. For when the volume of infections reaches a certain point then healthcare systems will be overwhelmed.
So if my forecast proves even remotely accurate then by the end of February 1 million will be infected, some 33X today's official number! At which point the virus will not be able to be contained within ANY BORDERS, as outbreaks numbering thousands of infected will be taking place in a number of countries that will play havoc with the worlds economies as the fear of infection drives consumer behaviour to avoid becoming infected as we have increasingly seen in China. Where huge mega cities are turning into ghost towns both as a consequence of frightened citizens and enforced quarantine.
Remember, folks if China is unable to contain the virus then what do you think is going to happen when the virus breaks out in less developed nations with barely functioning healthcare systems.
How long could the pandemic last ? We'll China is at Day 60 and the epidemic is still gaining momentum, so probably another month to run before China finally gets a grip on the virus by which time it will have spread across Asia and threatened the rest of the world. So when China is recovering the rest of the world will start to feel the brunt of their own epidemics.
US Stock Market Trend Implications
The Coronavirus IS a global PANDEMIC, which means it IS going to spread to EVERY Nation, there WILL be major outbreaks in the US and UK and the rest of the world. In terms of my forecast then these outbreaks should start manifesting by the end of February, which will likely be accompanied with weakening stock market indices as the outbreaks multiply and supply chains are increasingly hit even for Tech giants such as Apple given that all of it's iphones are made in China.
In terms of how bad, well it depends on the mortality rate and the number of infections by the end of February, as things stand the trend trajectory implies that 1 million infections by the end of February will only be the beginning, and that by the end of March the number could easily surpass 5 million globally! That at a 2% mortality rate implies 100,000 deaths! Hopefully, by then China at least will have gotten a grip on the virus and see diminishing number of infections. I will update my Corona virus trend forecast to include a trend trajectory for March towards the end of February.
So the Coronavirus trend trajectory forecasts stocks to enter a weak period before the end of February that looks set to continue into at least the end of March, beyond which it is difficult to say as a vaccine is not expected to materialise until some time in June so global Pandemic fears could rage into early Summer. That's 4 MONTHS OF ECONOMIC WEAKNESS! To imagine that is not going to effect stock prices is wishful thinking as we are witnessing some 31,000 official infections bringing CHINA to a virtual standstill. For instance Britain would experience a similar fate with fewer tham 1000 infections, the US perhaps 10,000. That would be enough to trigger economic contraction that the markets would discount ahead of time, so fall ahead of time.
The bottom line is that we are heading for Coronavirus induced global economic contraction as cross border travel and trade slows sharply from today to at least into the end of March 2020 and likely to the end of April so 2 to 3 months of lower economic growth that the stock markets will discount ahead of time.
Stock Market Deviation from Overall Outlook for 2020
My analysis of 30th December 2019 (Stock Market Trend Forecast Outlook for 2020) concluded in an overall outlook for the stock market for 2020 to target a trend towards 30,750 to 31,000 for a gain of between 8% to 9% for the year. This acts as a road map against which to measure relative strength or weakness as the Dow charts it's trend through the year.
A linear trend to 31,000 by end of 2020 would price the Dow at 28,830 today, against the last close of 29,102 which shows +272 point deviation against the linear trend, despite early January's surge to +750 that many had taken to imply 30,000 was just around the corner, instead resolving in a -600 deviation.
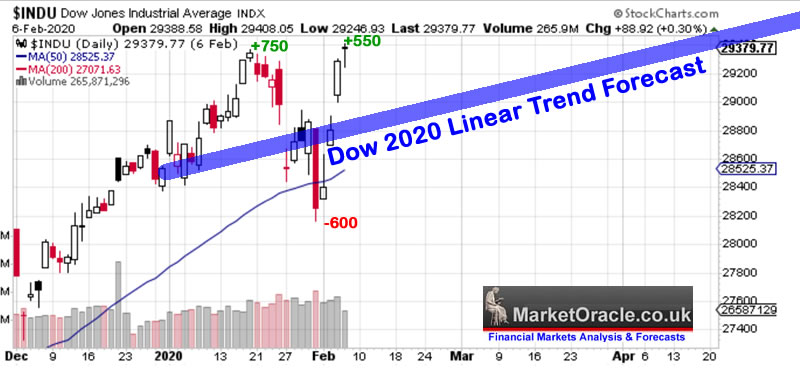
(Charts courtesy of stockcharts.com)
Therefore the Dow continues to target an oscillation around the linear trend forecast towards a target of about 31,000 late 2020, where a significant deviation against which would present a buying opportunity in target AI stocks, that is IF they succumb to general stock market selling.
Given the looming Coronavirus dark cloud then we thus should be expecting a deviation to well below the linear trend over the next couple of months or so, if not starting today then likely within the next week as the failure of the Chinese communist regime to contain the virus becomes apparent. Both in terms of reality and uncertainty as China on its own remains on a trend trajectory towards hitting 1 million infections by the end of February 2020, that's even if we can take the official statistics seriously.
QE4EVER
Money printing fundamentals remain in force. So any sign of economic weakness and the Fed will resume printing money / expand its balance sheet to support asset prices, especially during an election year.
DJIA Stock Market Technical Trend Analysis
As Goes January So Goes the Year
The Dow closed down on the month of January (28,256), accordingly the stock now only has a 50% chance of of ending up on the year. Where the average gain for a down January year is 1.35%. Against 9.1% for an up January. Which translates into expectations for more downside price action than there would have been had stocks closed higher in January.
TREND ANALYSIS
Short-term Trend Analysis
The Dow had a powerful bull run to a high of 29,380 early January that it just beat a trading day ago! So Fridays dip on face value is a reaction to hitting resistance.
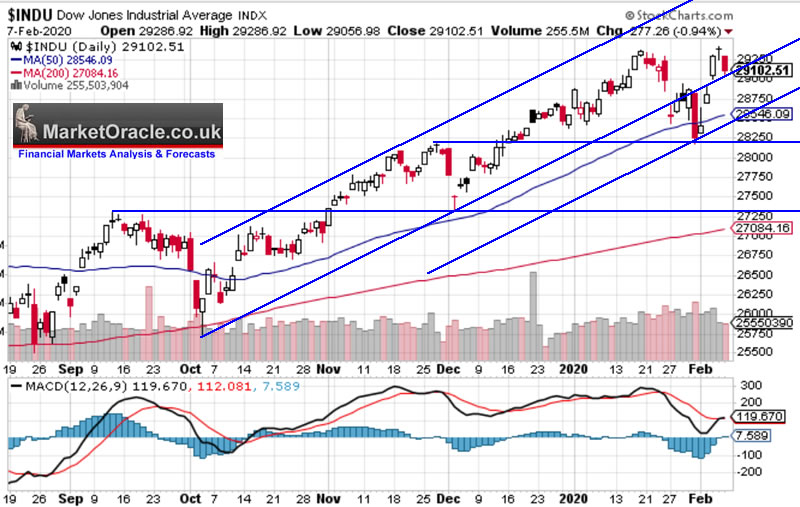
Furthermore the January correction was orderly, bouncing off of the previous high of 28,200. So in technical terms the current trend implies that the Dow is pausing before making another run for 30k. Even the MACD has unwound most of its overbought state of the past 3 months. The only negative is that the Dow breached the uptrend line during January's correction, but even there it has managed to recover to back above the original trendline despite Fridays drop.
Also there is a 30% probability that the Dow made a double top pattern which would target a drop to 27k. Though again it is a relatively low probability at this point in time.
Long-term Trend Analysis
The Dow has decidedly broken out of of a 2 year trading range that had kept the Dow capped at 27,400, thus triggering the next phase of the stocks bull market to continue higher for another year, first targeting 30k, then 31k for 2020.
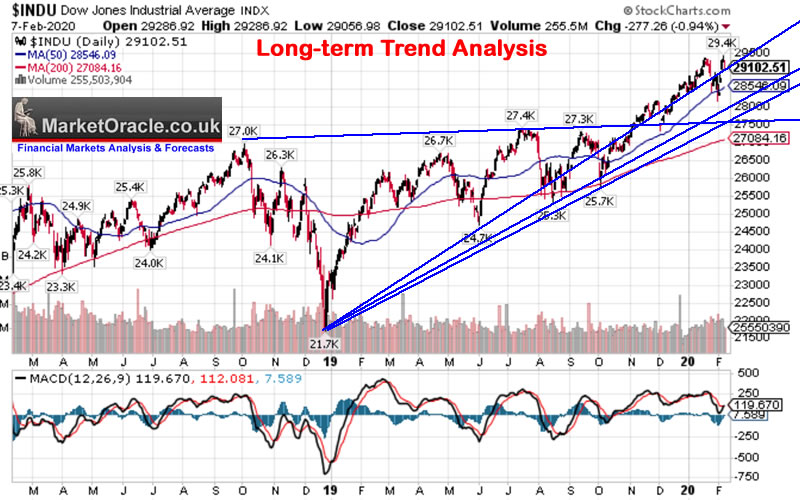
TREND ANALYSIS - The Dow continues to make higher highs and lows, so a strongly bullish picture. Again to emphasis that the Dow has broken out to the upside, so any downside price action should be seen as been being corrective.
RESISTANCE : Resistance is clearly at the current high of 29,408, and then 30,000.
SUPPORT : Is first at the recent low of 28,200 and then at just above the string of previous highs at 27,500. So any significant decline from 28,200 would be unlikely to trade below 27,500. Though a break below 27,300 would target 26,000.
TRENDLINES - Rising trend line supports are at 27,500, 28,000 and 29000.
The overall trend picture is bullish i.e. there is no sign for an imminent bear market. Too much support under the market and too soon after the breakout.
MACD - MACD is neutral.
ELLIOTT WAVES
Updating the chart from my 30th December analysis which warned to expect a correction towards 27,500 by the end of February:

The stock market does appear to be following a similar pattern which suggests to continue to expect a decline to 27,500 during Q1, roughly by end Feb / early March.
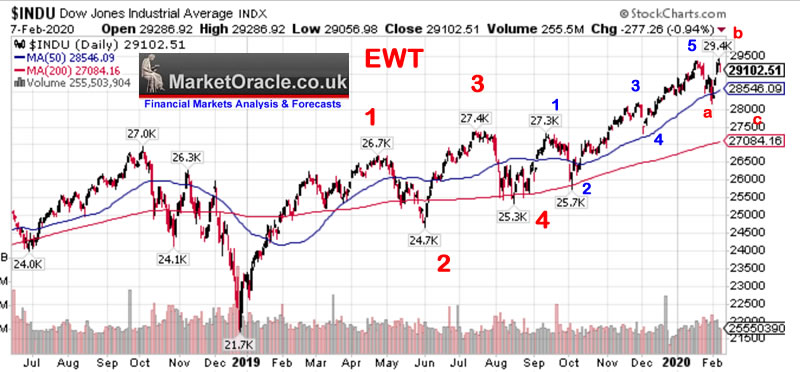
So EWT continues to suggest a weak Q1 for 2020.
Formulating a Stock Market Trend Forecast
The technical picture is contrary to my Coronavirus analysis. Where the Coronavirus paints a bleak picture, one of a global pandemic running into the tens millions of infections by the end of April 2020. Whilst the technical picture suggests to expect a relatively mild correction during Q1 following the breakout of the bull market from a 2 year trading range.
So maybe the Pandemic will not be as bad as the early trend suggest it to be.
Or more likely that the West will be better able to contain it's consequence by early March when this analysis suggests we may be passing the crest of the Coronavirus wave.
So whilst things ARE going to get much worse for another month or so. However, it looks like the rest of the world will do a much better job of coping with inevitable sporadic outbreaks than China has, and thus we should start to see a sharp slowdown in the number of infected.
Though we have NOT reached that point yet, and Coronavirus may yet deliver that major change in trend, anyway things will be much clearer a couple of weeks from now.
Dow Stock Market Forecast Update Conclusion
Therefore my forecast conclusion is for the Dow to be entering into an orderly correction towards trading down to as low as 27,500 by early March, when the world should be passing the worst of what the Coronavirus delivers in terms of rate of infections and number of deaths and thus sow the seeds for the stock market to rebound from it's deviation against my overall trend outlook for 2020.
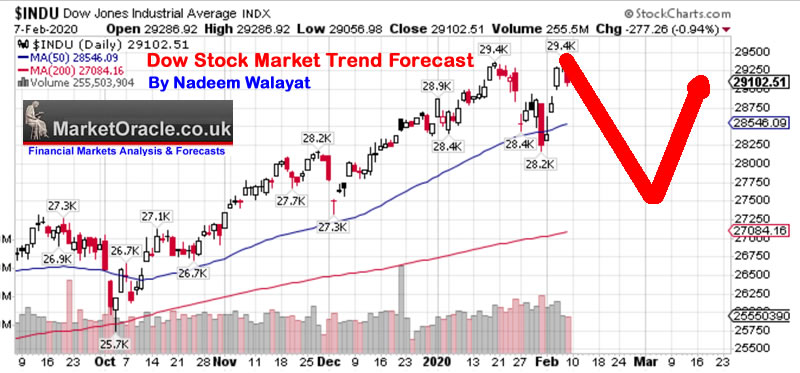
TRADING THE DOW - VERY HIGH RISK
Short 29,113 (current quote),
Stop 29505, Risk 392 points.
1st Limit 28,300 Reward 813 points (207%).
2nd limit 27650 Reward 1451 points (373%).
Remember folks trading stock index futures is VERY HIGH RISK!
It remains to be seen what sort of stocks buying opportunity a drop towards 27, 500 delivers in terms of the AI Mega-trend stocks (AI Stocks Buying Levels for Q1 2020) since they have been on quite a tear.
If the Coronavirus does start to fizzle out by early March by failing to significantly spread outside of China then that will speak volumes about the nature of Chinese society. It would suggest that China is NOT as robust as many perceive it to be. Not socially cohesive, immature even, the general population lacking empathy, selfish tendencies, not able to put themselves in their fellow chinese mans shoes, which is as a consequence of being told what to think since birth! So it looks like without FREEDOM of thought and expression then there will be tendency to produce a society that is populated with people who in large part do not behave how humans are meant to behave, a CCP version of Homo Sapiens.
To illustrate the point there are news reports of people infected with the virus in Wuhan going around spitting on other people who don't have the virus, spitting on various surfaces in residential blocks in attempts to infect others because they are angry that they have the virus so want others to also get the virus which explains why the Chinese authorities have not been able to contain the virus, it's because Chinese people in general don't give a shit about the fate of their fellow citizens.
And it remains to be seen if Coronavirus turns out to be as bad as what the current rate of infections implies, which should become apparent by the end of February. So it could prove ironic that rather than Coronavirus predicting the outlook for the stock market, instead the stock market turns out to predict a milder outlook for the Coronavirus that could pass it's peak before the end of February.
Will Trump Win US Presidential Election 2020?
My last look at the election was on 30th December 2020 which concluded that it was highly probable Trump would win the 2020 US Presidential Election, at the time Betfair was offering a price of 2.6 that would convert into a £160 profit for every £100 bet (including return of stake).
Following the failure of the Democrats to Impeach Trump, coupled with the Democrats chaotic Iowa Caucus compounded by Nancy Pelosi throwing a hissy fit at the State of the Union by ripping up a copy of Trumps speech then the probability of Trump winning should have increased.
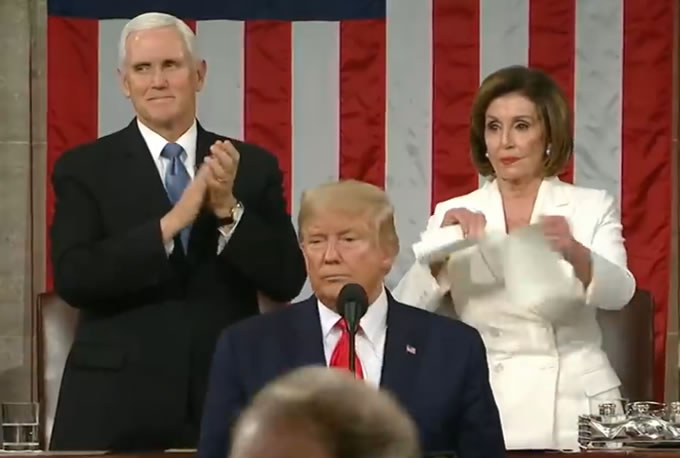
Betfair's current price on Trump being reelected has now narrowed to just 1.65. So unless the Democrats can pull off a miracle it does look like that Trump is heading for a second term in office.
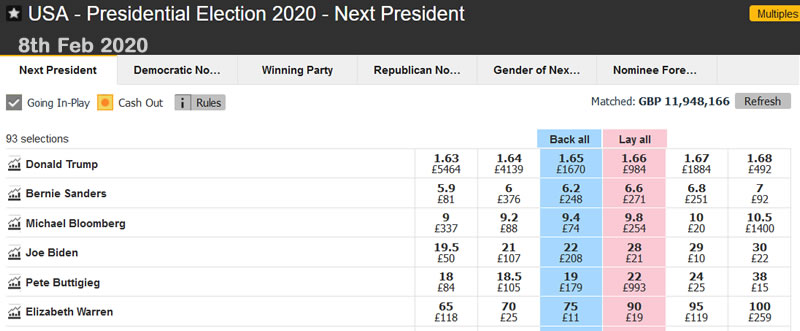
Still the election is some 9 months away, enough time for several odds moving surprise events to take place.
The bottom line is the probability of Trump being reelected has greatly strengthened since December 2019 and I don't see a Democrat candidate that could effect this probability to any significant degree. So buckle up folks for 4 more years of Trump!
Latest Analysis in this series includes -
26th Feb - The Coronavirus Stocks Bear Market Begins, When Will it End?
22nd Feb - Coronavirus Pandemic Stock Market Implications
So for immediate first access to ALL of my analysis and trend forecasts then do consider becoming a Patron by supporting my work for just $3 per month. https://www.patreon.com/Nadeem_Walayat.
Recent analysis includes :
- The Coronavirus Stocks Bear Market Begins, When Will it End?
- Coronavirus Pandemic Stock Market Implications
- Coronavirus Global Calm Before the Viral Storm - China Infection Statistics Probability Analysis
- UK Coronavirus COVID-19 Pandemic Trend Forecast to End March 2020
- Will CoronaVirus Pandemic Trigger a Stocks Bear Market 2020?
- Silver Price Trend Forecast 2020
- Gold Price Trend Forecast 2020
- British Pound GBP Trend Forecast 2020
- AI Stocks 2019 Review and Buying Levels Q1 2020
- Stock Market Trend Forecast Outlook for 2020
Scheduled Analysis Includes:
- UK Housing market series
- Machine Intelligence Investing stocks sub sector analysis
- Bitcoin trend forecast
- Euro Dollar Futures
- EUR/RUB
- US House Prices trend forecast update
And ensure you are subscribed to my ALWAYS FREE newsletter for my next in-depth analysis.
Your Analyst
Nadeem Walayat
Copyright © 2005-2020 Marketoracle.co.uk (Market Oracle Ltd). All rights reserved.
Nadeem Walayat has over 30 years experience of trading derivatives, portfolio management and analysing the financial markets, including one of few who both anticipated and Beat the 1987 Crash. Nadeem's forward looking analysis focuses on UK inflation, economy, interest rates and housing market. He is the author of five ebook's in the The Inflation Mega-Trend and Stocks Stealth Bull Market series that can be downloaded for Free.
 Nadeem is the Editor of The Market Oracle, a FREE Daily Financial Markets Analysis & Forecasting online publication that presents in-depth analysis from over 1000 experienced analysts on a range of views of the probable direction of the financial markets, thus enabling our readers to arrive at an informed opinion on future market direction. http://www.marketoracle.co.uk
Disclaimer: The above is a matter of opinion provided for general information purposes only and is not intended as investment advice. Information and analysis above are derived from sources and utilising methods believed to be reliable, but we cannot accept responsibility for any trading losses you may incur as a result of this analysis. Individuals should consult with their personal financial advisors before engaging in any trading activities.
Nadeem Walayat Archive |
© 2005-2022 http://www.MarketOracle.co.uk - The Market Oracle is a FREE Daily Financial Markets Analysis & Forecasting online publication.


