Stock Market Elliott Wave Analysis and Silver Recessions
Stock-Markets / Stocks Bear Market Oct 07, 2008 - 06:01 AM GMTBy: Roland_Watson

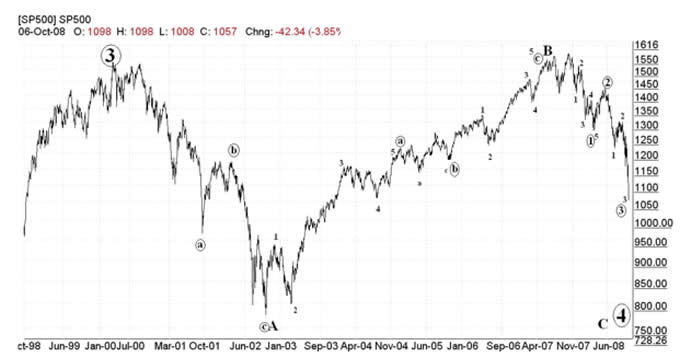
 When is it going to end for the stock market woes and for silver? The Elliott Wave analysis which helped us see this major top for silver and gold is giving a signal for the general stock market as we find it in the S&P 500. The chart below sums it up and tells us that the S&P bear market is almost over.

To give the main background, the stock market has been correcting the bull market of 1974 to 1999 (wave 3 at top left of chart). Before that we had a bear market between 1968 and 1974 (wave 2) which corrected the bull market of 1942 to 1968 (wave 1). We are now in correction wave 4 which is just about done. When that finishes it will be a final multi-year wave 5 up to complete a mega 80 year bull market which will be followed by a major bear market that may well exceed that of the 1930s and early 1940s.
Note that the S&P500 has been tracing out what we call a flat wave. This is the most common wave formation for a wave 4 and it has more or less been working itself out in textbook fashion. That means that the final leg down (or C wave) will erase most if not more of the B wave before we call this bear market over. Where that C wave is heading is shown on the decomposition of the wave to the right of the chart. A wave C of a flat correction is a 12345 impulse wave 90% of the time, so we have a degree of confidence in our wave analysis. We are actually in the worst part of the C wave as we enter the infamous "wave 3 of 3". That strongest downside will end soon and will then embark on a wave 4 correction before the final wave 5 down completes the 8 year bear market. Where that ends exactly will only become apparent as the pattern unfolds but I have a personal conviction that boarding the stock market train near that point will see great returns into next decade.
So where does this leave silver?
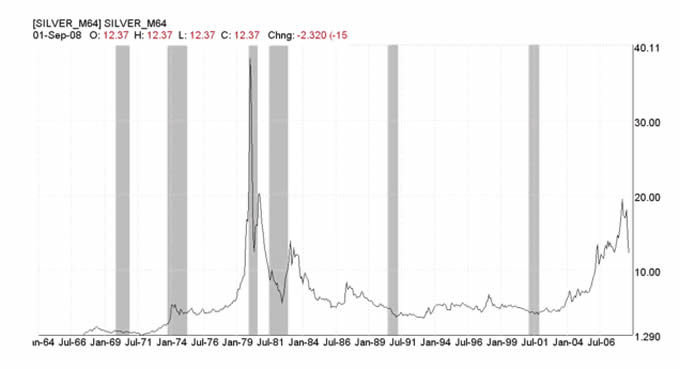
I have always advocated sensible asset allocation; never put all our eggs in one basket because the future may not be as certain as you think. With that in mind a proportionate and reasonable allocation both to equities and precious metals is in order. The truth for silver just now is that until this economic downturn blows over, silver is not a buy. There may be short term opportunities in silver (e.g. a B wave rally) but the real bottom lies a little further ahead. A chart of silver versus recession proves our point.

Note that silver does not do well during the recessionary periods in grey bars. I see no reason for that to change and am actually surprised we haven't entered recession already. When recession blows over and the main economic health indicators begins to flash green again we will be back into silver and look forward to more upside as inflation again begins to assert itself across the board. We will keep subscribers informed of both the general stock market opportunity as well as the precious metals one.
In the meantime keep your powder dry as fabulous buying opportunities beckon ahead of us!
By Roland Watson
http://silveranalyst.blogspot.com
Further analysis of the SLI indicator and more can be obtained by going to our silver blog at http://silveranalyst.blogspot.com where readers can obtain the first issue of The Silver Analyst free and learn about subscription details. Comments and questions are also invited via email to silveranalysis@yahoo.co.uk .
Roland Watson Archive |
© 2005-2022 http://www.MarketOracle.co.uk - The Market Oracle is a FREE Daily Financial Markets Analysis & Forecasting online publication.


