


What Can Stop the Stocks Bull – Or At Least, Make It Pause?
Stock-Markets / Stock Markets 2020 Feb 20, 2020 - 02:50 PM GMTBy: P_Radomski_CFA

Stocks are entering the holiday-shortened week on a strong note. There was no selloff on Friday, as has been the case three preceding weeks in a row. This weekend, there were no spooky coronavirus headlines. Stocks finished on Friday close to their yearly highs, and the beat goes on. In light of today’s premarket decline, the following question is in order. Does the beat really go on?
We’ll start the thorough examination with the weekly chart (charts courtesy of http://stockcharts.com).
Stocks built on last weeks’ gains, and keep trading farther and farther away from the upper border of the rising purple trend channel. While weekly volume doesn’t flash any warning signs of an impending reversal, what about the other indicators?
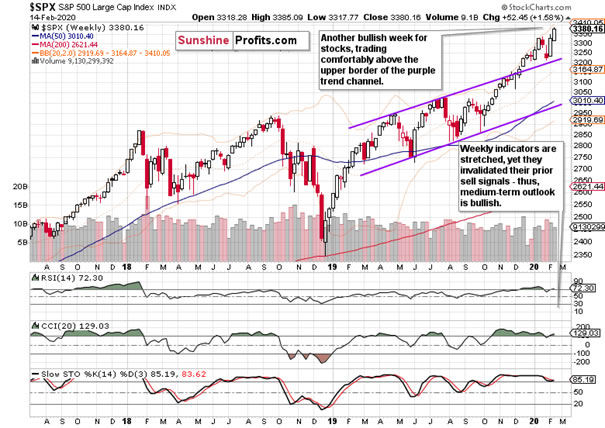
Both the RSI and CCI are back into overbought territory, and their brief dips that flashed sell signals have been invalidated. Acting on Stochastics’ sell signal generated in its overbought area would indeed lead to a whipsaw. In short, the weekly indicators continue to comprehensively support the bulls.
Let’s move to the daily chart.
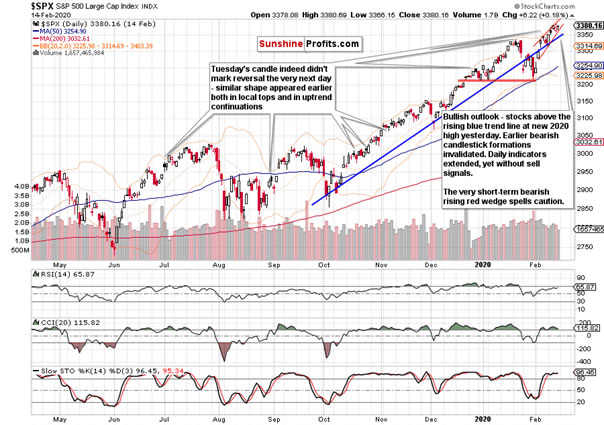
Last Tuesday’s candle wasn’t a hallmark of topping action. Neither were the extended daily indicators. Yes, they look tired and in need of rest but that doesn’t mean stocks have to oblige and roll over sizably. Sure, their position deserves attention but they have not flashed reliable sell signals.
The very short-term rising red wedge warrants caution. Not for its steepness but because rising wedges usually bring about a bearish resolution as prices have to maintain upside momentum to keep trading inside the formation. Should prices break down from it, their first line of support would be the rising blue trend line.
As a result, the daily outlook is vulnerable to a downside hit, even as the bulls are making new highs. It would take several strongly bearish sessions to take away the bullish bias though – and none has taken place.
What about the breadth indicators, what are they telling us in the short-term?
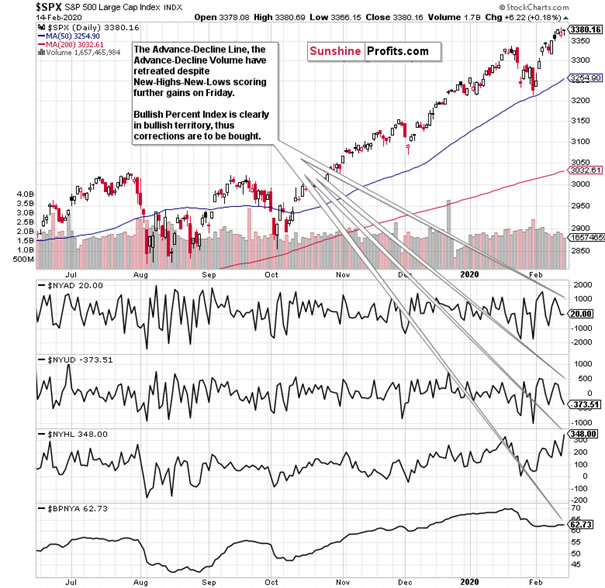
Nothing all too special. The decline in both the advance-decline line and the advance-decline volume spells a short-term deterioration, yet new highs minus new lows keep moving higher. This constellation points to stocks undergoing a soft patch that isn’t (yet?) reflected in prices. Why is the yet with a question mark? It’s because this might be all there is for the soft patch, and all the earlier mentioned signs of caution may as well get worked out by a shallow correction and a continuing slow grind higher.
Remember, the bullish percent index solidly above 50% and not in a recent downtrend, shows prevailing buying interest – in other words, upswing confirmation and the bull market is the valid conclusion here.
Let’s check now whether we can find more clues looking into the internals.
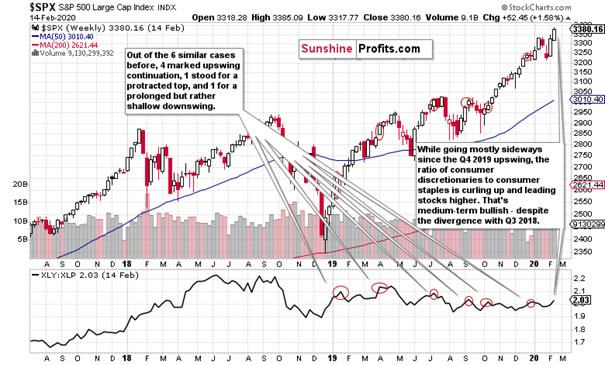
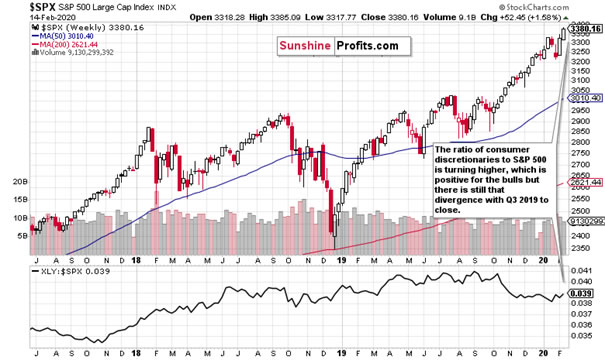
It’s the ratio of consumer discretionaries to consumer staples that you can see below the price chart. Intuitively, discretionaries outperforming staples should highlight bright economic outlook that gets reflected in higher stock prices. Let’s examine the previous cases (circled in red on the above chart) that are similar to the current situation and see how they were resolved.
They send a bullish message, as out of the 6 instances, 4 were followed by upswing continuation, 1 by prolonged topping action, and 1 by a lengthy but relatively shallow downswing that gave way to upswing continuation next. In both not-immediately-bullish case, one had to wait about a month for the upswing to continue.
So, it’s safe to say that if the indicator confirms the price advance, it’s one more bullish signal. When it doesn’t, it either catches up over time, or the divergence gets resolved by the price moving lower temporarily – remember the above 2 cases. It has to be said though, that a divergence with the Q3 absolute indicator’s top can last for a very long time and not trigger a sizable downside move while it lasts.
It’s true that the ratio has topped in Q3 2018. Yet after bottoming out in December 2018, it hasn’t been standing in the way of the stock rally, and its ongoing divergence didn’t trigger a plunge in stocks. Now, it’s encouragingly curling higher, and its 2020 low is higher than the December 2019 low. That’s bullish for the medium-term.
If we look at the ratio of consumer discretionaries to the stock market, we immediately see whether they outperform the whole stock market. When they do, it again points to improving outlook, and works as a tailwind for stocks. It must be said, the ratio is rising since the January 2020 bottom, which adds to the medium-term bullish picture.
While the bulls still have quite a job ahead since the ratio topped in Q3 2020, remember that such divergencies can take ages to resolve. Therefore, look at their recent dynamics and swing structure instead of an absolute level.
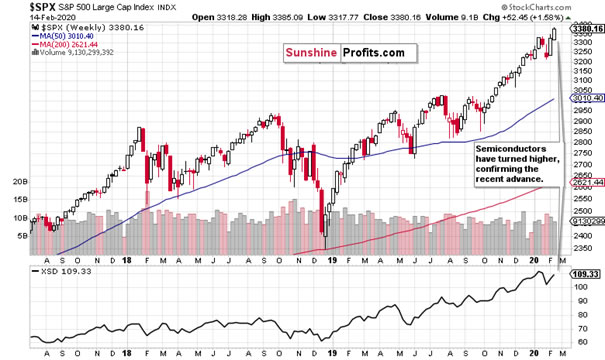
Semiconductors are another promising area to look at. While the retail side of the market tends to catch fire in the latter stages of expansions, this is more of a leading or coincident indicator if you will. And it has to be said that semiconductors have been doing very well recently.
Rising strongly throughout 2019, they dipped briefly in late January 2020. A strong recovery followed and previous highs are in sight. That’s another medium-term confirmation of the current stock advance.
Before summarizing, let’s turn to small caps.
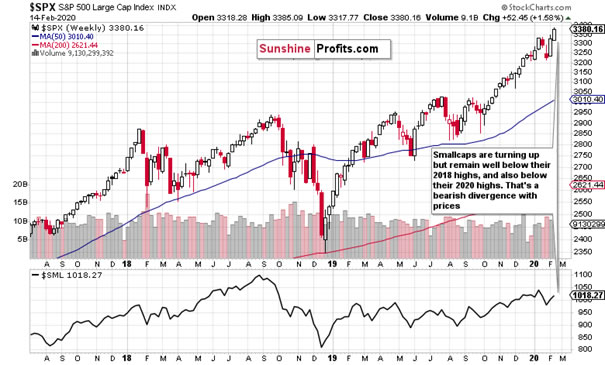
They’re a valuable indicator showing the breadth of market advance. Do they confirm the current one? They still have to rise a bit more to overcome their 2020 highs. But how much of a concern is it that they haven’t yet done so? Since bottoming out in December 2018, they have been slowly but surely moving higher.
The weeks of their sideways trading weren’t an obstacle to stocks making higher highs and higher lows – and we expect it to be the case into the future too. In other words, this short-term non-confirmation doesn’t have bearish implications
As you have seen, the technical factors speak overwhelmingly in favor of the long position. The medium-term charts have a strongly bullish outlook, and it’s only the short-term where we see some potential for a spanner in the works of new 2020 highs on a daily basis. Last but not least, the fundamental backdrop presented on Friday supports higher prices ahead as well.
Summing up, the S&P 500 outlook remains bullish. Price examination, weekly and daily indicators are still sufficiently supported by the breadth indicators, and continue to favor upswing continuation. While there are signs warranting caution on the daily chart, and divergences in market internals such as consumer discretionaries to consumer staples, consumer discretionaries to S&P 500, semiconductors or small caps to the S&P 500, they aren’t an obstacle to the bull market continuation. Favorable resolution is expected as the index keeps making and challenging new 2020 highs practically on a daily basis, any imaginable correction isn’t likely to stretch much below 3200 in our opinion. The currently open long position remains justified, and our aim is to let the many bullish factors in this stock bull market keep working to our benefit.
If you enjoyed the above analysis and would like to receive daily premium follow-ups, we encourage you to sign up for our Stock Trading Alerts to also benefit from the trading action we describe – the moment it happens. The full analysis includes more details about our current positions and levels to watch before deciding to open any new ones or where to close existing ones. Check more of our free articles on our website – just drop by and have a look. We encourage you to sign up for our daily newsletter, too - it's free and if you don't like it, you can unsubscribe with just 2 clicks. If you sign up today, you'll also get 7 days of free access to our premium daily Stock Trading Alerts as well as our other Alerts. Sign up for the free newsletter today!
Thank you.
Monica Kingsley
Stock & Oil Trading Strategist
Sunshine Profits - Effective Investments through Diligence and Care
Monica Kingsley is a trader and financial markets analyst. Apart from diving into the charts on a daily basis, she is very much into economics, marketing and writing as well. Naturally, she has found home at Sunshine Profits - a leading company that has been publishing quality analysis for more than a decade. Sunshine Profits has been founded by Przemyslaw Radomski, CFA - a renowned precious metals investor and analyst.
Disclaimer
All essays, research and information found above represent analyses and opinions of Przemyslaw Radomski, CFA and Sunshine Profits' associates only. As such, it may prove wrong and be a subject to change without notice. Opinions and analyses were based on data available to authors of respective essays at the time of writing. Although the information provided above is based on careful research and sources that are believed to be accurate, Przemyslaw Radomski, CFA and his associates do not guarantee the accuracy or thoroughness of the data or information reported. The opinions published above are neither an offer nor a recommendation to purchase or sell any securities. Mr. Radomski is not a Registered Securities Advisor. By reading Przemyslaw Radomski's, CFA reports you fully agree that he will not be held responsible or liable for any decisions you make regarding any information provided in these reports. Investing, trading and speculation in any financial markets may involve high risk of loss. Przemyslaw Radomski, CFA, Sunshine Profits' employees and affiliates as well as members of their families may have a short or long position in any securities, including those mentioned in any of the reports or essays, and may make additional purchases and/or sales of those securities without notice.
© 2005-2022 http://www.MarketOracle.co.uk - The Market Oracle is a FREE Daily Financial Markets Analysis & Forecasting online publication.