Stock Market Trend Forecast Outlook for 2020
Stock-Markets / Stock Markets 2020 Feb 01, 2020 - 06:19 PM GMTBy: Nadeem_Walayat
The first part of my overall stock market outlook for 2020 was posted at the start of January, now here is the full analysis that concludes in an overall forecast for the Dow into the end of 2020, a gauge against which to measure relative strength or weakness as the stock market trends through the year.
This analysis was first been made available to Patrons who support my work: Stock Market Trend Forecast Outlook for 2020
So for immediate first access to ALL of my analysis and trend forecasts then do consider becoming a Patron by supporting my work for just $3 per month. https://www.patreon.com/Nadeem_Walayat.
The Stocks bull market is on course to end 2019, it's 11th year up by 24% with the Dow's last close of 28,462 against 23,062 of 31st Dec 2018.
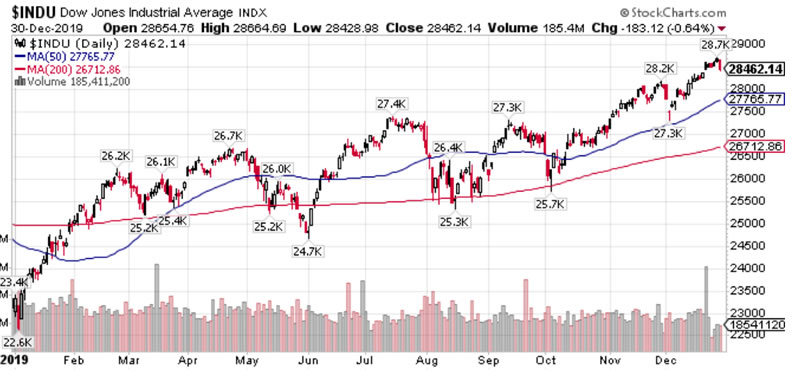
My expectations for virtually the whole of this year has been for the Dow to target a trend towards at least Dow 28k by the end of the 2020, including to expect a Santa rally of sorts to materialise.
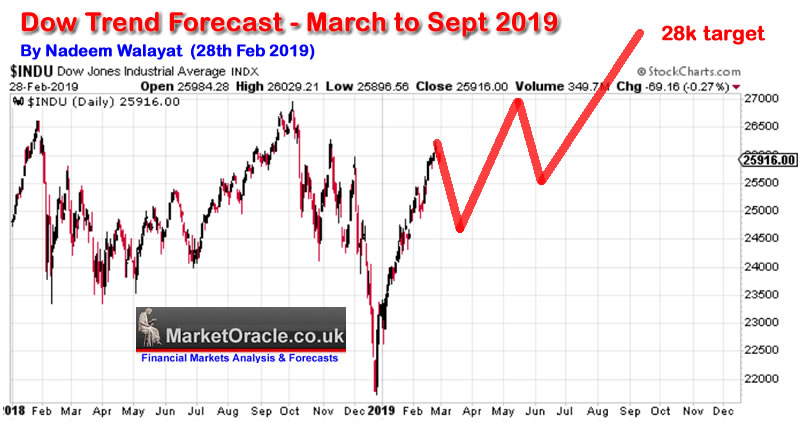
1st March 2019 - Stock Market Trend Forecast March to September 2019
Therefore my forecast conclusion as illustrated by the below chart is for the Dow to target a trend to at least Dow 28,000 by Mid September 2019.
Initially the Dow looks set to correct during March to approx 24,500 before rallying to attempt to break above 27,000 during May, a correction from which should set the scene for an eventual breakout to 28,000 by Mid September.
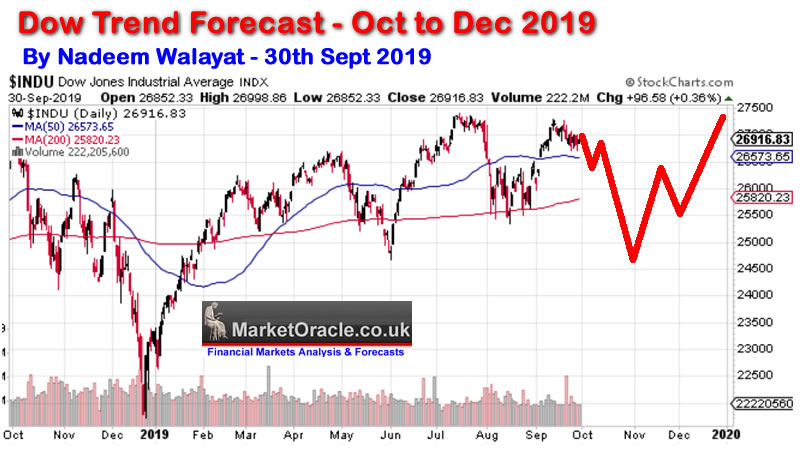
30th Sept 2019 - Dow Stock Market Trend Forecast Oct to Dec 2019
Therefore my forecast conclusion as illustrated by the below chart is for the Dow to target a trend towards Dow 27,500 by the end of this year following a significant correction during October that could see the Dow trade as low as 24k.
(Charts courtesy of stockcharts.com)
23rd Oct 2019 - Dow Stock Market Trend Forecast October Update
Therefore my forecast update as illustrated by the below chart is for the Dow to continue to target a trend to at least Dow 27,500 by the end of this year following a significant correction low that has likely shifted a couple of weeks into Mid November.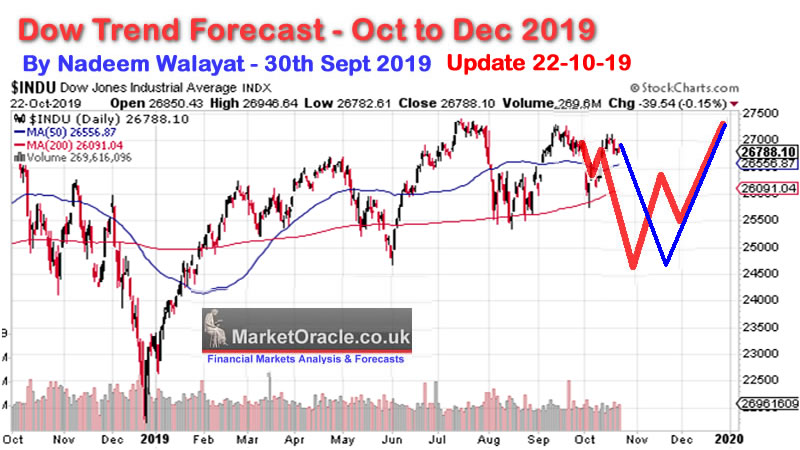
Stock Market Analysis 2020
This is my overall outlook for what to expect for 2020, i.e. that seeks to answer whether the Dow will end the year higher or lower and by roughly how much. Which I will follow up with a series of in-depth pieces of analysis that typically conclude in 2-3 month trend forecasts, similar to that for 2019, with the first detailed trend forecast to be completed during January.
But first an overall road map of what to expect for 2020!
REMEMBER QE IS FOREVER!
My consistent message since QE money printing began a few weeks prior to the birth of this stocks bull market in March 2009, my message has been that once QE money printing starts then it NEVER ENDS! So LEVERAGE once self to the perma money printing INFLATION MEGA-TREND. Invest in assets that are LEVERAGED TO INFLATION.
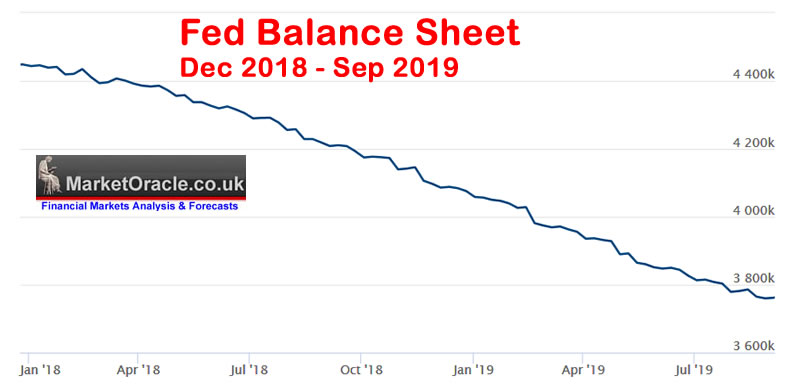
And so it has been for the whole of 2019, even in the wake of the Fed's apparent unwinding of its balance sheet from about £4.4 trillion down to $3.75 trillion as the below graph illustrates -
April 30th 2019 - US House Prices Trend Forecast 2019 to 2021
QE4EVER!
A reminder folks that regardless of Fed propaganda and what you read in the mainstream press QE is 4 EVER! Once it starts it doesn't stop. As I iterated 2 months ago in my stock market analysis at the start of March (Stock Market Trend Forecast March to September 2019)
So why has the the stock market soared, what is that the stock market knows that most commentators and economists fail to comprehend? We'll for one thing there are the dovish signals out of the Fed which go beyond a pause in their interest rate hiking cycle in response to a subdued inflation outlook. Similarly the worlds other major central banks have their own reasons to avoid rate hikes, most notable of which is the Bank of England that has been busy propagandising the prospects of a NO Deal Brexit Armageddon in attempts to scare Westminister into avoiding EXITING the European Union in anything other than an ultra soft BrExit.
So on face value the stock market is clearly discounting not just a more accommodative interest rate environment but that QE REALLY IS FOREVER! Once it starts it DOES NOT STOP! As evidenced by the Fed's balance sheet first having exploded from about $800 billion to over $4.5 trillion, all to bailout the banking crime syndicate by inflating asset prices such as housing and stocks so as to generate artificial profits for the central bankers banking brethren. But none of this news, for I have written of it for a good 10 years now that QE will never stop as the worlds central banks will repeatedly expand QE to monetize government debt.
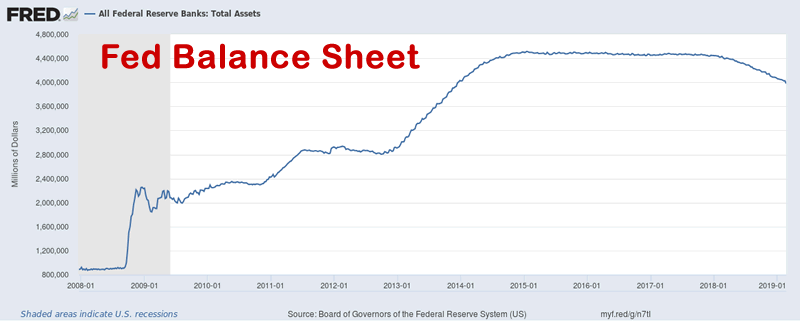
So I would not be surprised that WHEN the next crisis or recession materialises, QE will resume, by the end of which the Fed balance sheet will likely have DOUBLED to at least $8 trillion. And it is this which the stock market is DISCOUNTING! Just as has been the case for the duration of this QE driven stocks bull market that clearly paused during 2018 in the wake of mild Fed unwinding of its balance sheet. So forget any lingering Fed propaganda for the continuing unwinding it's balance sheet, the actual rate of of which has slowed to a trickle and thus we are probably near the point when the Fed ceases unwinding it's balance sheet because as I have often voiced that once QE starts it does NOT STOP!
So whatever form the NEXT crisis takes, the Fed will be at hand to print money and double its balance sheet, as it will periodically continue to supports asset prices such as housing which cannot be printed. We'll not until we see start seeing house building 3D printing drones emerge from the machine intelligence mega-trend that will fly around in swarms and erect designer houses anywhere on the planet.
So it was only a matter of time before the Fed started the printing presses rolling once more and this without any obvious reason to do so, other than that the Fed MUST avoid any chances of a recession during an election year which is precisely what the Fed has now succeeded at doing!
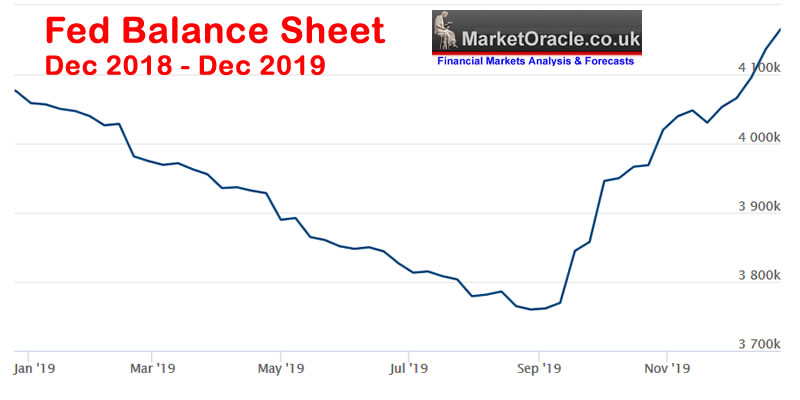
RAMPANT MONEY PRINTING that makes a mockery of the propaganda of Fed unwinding QE that many swallowed for much of 2019. What this means is that there is NOT going to be a recession in 2020! So you can forget about all of the recession noise in the mainstream media of recession risks for stocks. Which means this ageing stocks bull market looks set to have another bullish year!
Long-term Trend Analysis
The Dow finally breached resistance along a series of sub 28k highs of the past 2 years that propelled the Dow towards 29k.
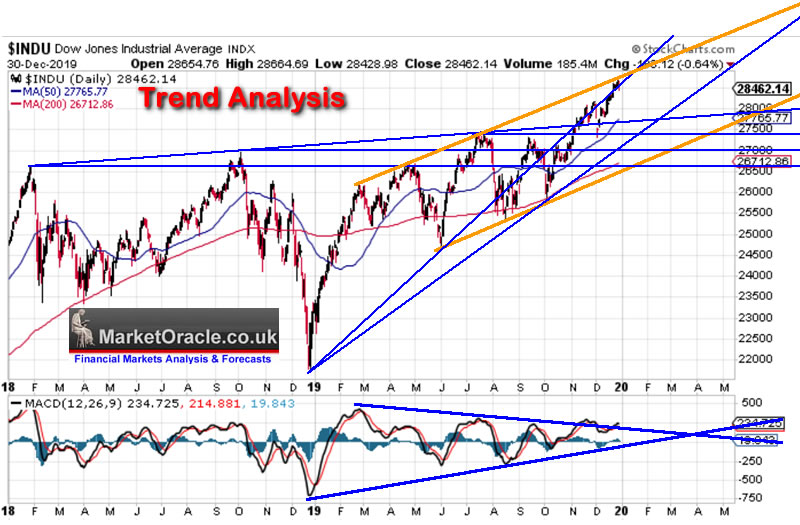
TREND CHANNELS - The Dow for most of 2019 has traded within a relatively tight bullish trading channel. With the most recent price action a reaction from the trend channel high. If the Dow continues to trade in this channel then that would put a cap on the Dow at about 33000 or +16%. Whilst the bottom end of the trading range by year end would resolve to about 29,100, or +2.2%. With the mid channel at about +7.6%
TREND ANALYSIS - The Dow has had a powerful run off the 26,000 low and now hit resistance at just below 29k which implies that the Dow should correct early 2020 down towards 27,500.
RESISTANCE : Resistance lies at new all time highs of 29,000, 30,000. 31,000 and beyond.
SUPPORT - is along a series of highs in the range of 26,500 to 27,500, so any decline should see a bounce from this range.
TRENDLINES - There are 2 rising trend lines off the major low of 21,700. With the Dow currently hugging the first to resistance that should give way for the Dow to target hugging the 2nd trend line which extends to about 31k by year end.
The overall trend picture is for limited upside during 2020, i.e. we are very unlikely to see a repeat of 2019's 24% gain.
MACD - MACD is overbought so implies continued upward price action is unlikely early January.
ELLIOTT WAVES
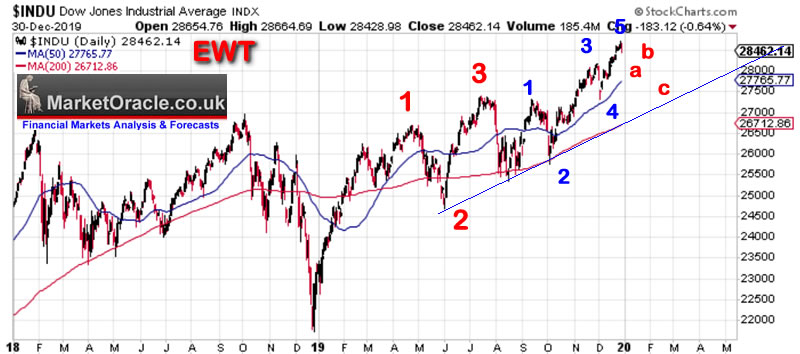
Elliott wave Pattern suggest to expect a correction during the 1st quarter of 2020 before the Dow can once more target new highs during the new year.
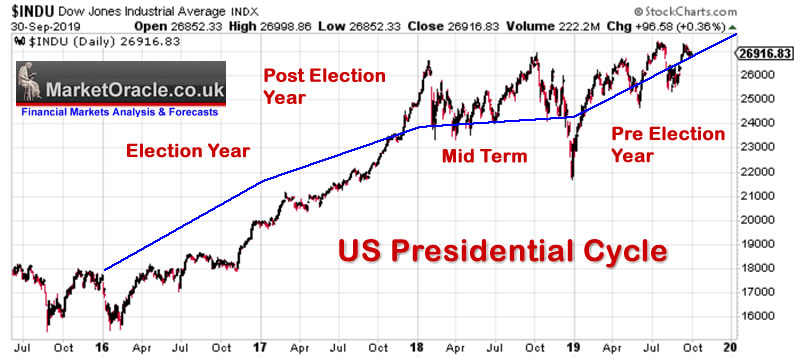
US Presidential Cycle
The US Presidential cycle pattern has proved REMARKABLY ACCURATE for 2019, where the basic pattern for the US Presidential cycle is for a strong election year and post election year, followed by weak Mid-term then a strong pre-election year which is what we saw with 2019 as the chart from my September update illustrates. That implies to expect similar strength for 2020 as we had for 2019!
Formulating a Stock Market Outlook for 2020
This analysis strongly suggests to expect the Dow to end 2020 up on the year. However the year end possible range is quite wide from a high of Dow 33,000 (+16%) to a low of Dow 29,100 (+2.2%). However the Presidential election year tends to be strongly bullish so the Dow is more likely to end 2020 nearer to +16% than +2%. And that the Dow HAS broken out of a 2 year range capped at 28k which should act to propel the Dow higher to at least Dow 30k.
Whilst early 2020 price action could see a correction given that the Dow is trading off resistance and EWT implies a correction has already begun.
Dow Stock Market 2020 Outlook Forecast Conclusion
Therefore my forecast conclusion is for the Dow to target a trend to between 30,750 and 31,000 by the end of 2020. For a likely gain of 8% to 9% for the year (on the last close of 28,642).
My series of 2020 stock market analysis will seek to map out multi-month detailed trend forecasts as was the case for 2019. With the first to be completed during January, going into which my expectations are for a correction early 2020. Which given my bullish outlook implies should prove to be a buying opportunity.
My latest Silver price trend analysis that concludes in a detailed trend forecast for 2020 has first been made available to Patrons who support my work (Silver Price Trend Forecast 2020).
- Silver Price Trend 2019
- Silver Investing Strategy
- Gold Price Trend Forecast Implications for Silver
- Gold / Silver Ratio
- Long-term Trend Analysis
- Trend Analysis
- MACD
- Elliott Waves
- Formulating a Trend Forecast
- Silver Price Trend Forecast 2020
So for immediate first access to ALL of my analysis and trend forecasts then do consider becoming a Patron by supporting my work for just $3 per month. https://www.patreon.com/Nadeem_Walayat.
Recent analysis includes :
- Gold Price Trend Forecast 2020
- British Pound GBP Trend Forecast 2020
- AI Stocks 2019 Review and Buying Levels Q1 2020
- Stock Market Trend Forecast Outlook for 2020
Whilst my next soon to be completed analysis will be a detailed trend forecast for the Stock Market.
Scheduled Analysis Includes:
- UK Housing market series
- Machine Intelligence Investing stocks sub sector analysis
- Bitcoin trend forecast
- Euro Dollar Futures
- EUR/RUB
- US House Prices trend forecast update
So for immediate first access to ALL of my analysis and trend forecasts then do consider becoming a Patron by supporting my work for just $3 per month. https://www.patreon.com/Nadeem_Walayat.
Your Analyst
Nadeem Walayat
Copyright © 2005-2020 Marketoracle.co.uk (Market Oracle Ltd). All rights reserved.
Nadeem Walayat has over 30 years experience of trading derivatives, portfolio management and analysing the financial markets, including one of few who both anticipated and Beat the 1987 Crash. Nadeem's forward looking analysis focuses on UK inflation, economy, interest rates and housing market. He is the author of five ebook's in the The Inflation Mega-Trend and Stocks Stealth Bull Market series that can be downloaded for Free.
 Nadeem is the Editor of The Market Oracle, a FREE Daily Financial Markets Analysis & Forecasting online publication that presents in-depth analysis from over 1000 experienced analysts on a range of views of the probable direction of the financial markets, thus enabling our readers to arrive at an informed opinion on future market direction. http://www.marketoracle.co.uk
Disclaimer: The above is a matter of opinion provided for general information purposes only and is not intended as investment advice. Information and analysis above are derived from sources and utilising methods believed to be reliable, but we cannot accept responsibility for any trading losses you may incur as a result of this analysis. Individuals should consult with their personal financial advisors before engaging in any trading activities.
Nadeem Walayat Archive |
© 2005-2022 http://www.MarketOracle.co.uk - The Market Oracle is a FREE Daily Financial Markets Analysis & Forecasting online publication.


