FOMO or FOPA or Au?
Stock-Markets / Financial Markets 2020 Jan 20, 2020 - 07:26 AM GMTBy: Raymond_Matison
FOMO, the well-known acronym standing for “Fear Of Missing Out” relates to the conviction that an investor needs to remain invested in financial markets for otherwise he may miss out gains which are generated by steadfast easy money policies of the FED. It also embodies the belief that if markets are to decline from deteriorating economic fundamentals, the FED will bail out investors by providing some kind of additional market stimulus. Embracing this simple principle has been profitable to investors in recent years. FOMO encapsulates the oft-proven axiom: don’t fight the FED.
FOPA, is newly-conjured acronym standing for “Fear Of Participating in the Avalanche” which relates to the possibility of a sudden or severe market decline. Interestingly, this acronym has the same pronunciation as the well-known French term “faux pas” which can be translated as “mistake”. Those more conservative investors suspicious of present bubble markets will avoid FOMO investing principles not wanting to make an investment strategy mistake, and therefore embrace FOPA - simply exiting the market to hold cash.
Au is the scientific symbol in Mendeleev’s Periodic Table of elements for gold. Gold has evolved over millennia through market competition throughout the world to serve as mankind’s preference for money. Every paper form of money ever created has ultimately failed, reducing to a zero value. Present use, still-existing paper currencies have proven to be poor stores of value, as relentless expansion of the currency supply reduces purchasing value. Gold is the ultimate proven holder of value, and as such is purchased at times when financial markets are chaotic or at risk of substantial decline. Investors concerned that a FOPA investment strategy, while protecting against a market decline, does not protect one against a financial system collapse will activate the Au asset preservation policy.
Thus the battle lines are drawn between those who want to continue to ride the markets and not miss out additional FED-protected gains (the FOMO thesis), and those who do not want to make the mistake by being caught up in the avalanche of crashing markets (the FOPA thesis), and those who have decided to seek the ultimate shelter from economic, market or financial system failure (the Au thesis) who have exchanged their dollar-based financial assets for physical gold. This article looks deeper into these three strategies and destroys some illusions while confirming some unpleasant economic realities.
Recent market performance
Market performance in equities and fixed income over the last decade or more has embarrassed many financial professionals who have predicted declines. It has also embarrassed all precious metal pundits who for over the last decade have predicted a precious metal rally. The robust long-term market performance in equities and fixed income would be impossible without substantial intervention and support by the FED – dramatic expansion of the money supply and reduction of interest rates. But the support was there, and the markets have exploded to the point that most market observers agree that we have bubble markets. Rallying financial markets over this period and targeted manipulation suppressed precious metal performance. In the meantime, these respectable professionals who were guided accurately by economic and market fundamentals have been proven to be wrong – or at least substantially off in timing for predicting a market demise.
To understand how such bubble markets came about, it is important to go back to 1999 when the Glass-Steagall Act was repealed. This act was originally passed during the Great Depression in 1933 to separate retail and commercial loan function of banks from investment banking and speculation which had contributed to bank failures. After much lobbying by banks, and the 1999 repeal, commercial banks could again speculate in the markets with depositor money. With liberalization of minimum required capital, deregulation of derivatives, and access to repo financing, the stage was set for expanded bank speculation.
Since banks were drivers and participants in the mortgage financial demise of 2008, and required massive multi-trillion dollar FED capital infusions and bailouts, one could propose that the Glass-Steagall act contains great insight and wisdom separating or at least constraining bank activities. Recognizing that some major banks at present hold trillions dollars-worth of potentially explosive oil and interest rate derivatives, allowing banks to speculate may yet promote their doom. There is no bank or company that is too big to fail, financially significant or not. In addition, making repo liquidity facilities available to hedge funds may help blow up the whole financial system such that even the FED cannot contain it.
The FED accommodated banks with new money creation that was channeled into financial markets which went up without this currency creation causing significant increases in consumer goods prices. After the stock market crash of 2000, markets zoomed with amazing vitality as new credit expansion was then channeled to mortgages and housing. Banks became quite expert at channeling funds to specific segments of the economy so that banks and the rich could get wealthier, while others with exposure to the markets, if even only though their participation in pension funds, benefited. Nonetheless, wealth disparity – actually inequality- between the top .01% and everyone else expanded dramatically, as pension fund liabilities increased while pension fund assets despite rising markets became increasingly underfunded. See: Market Decline Will Lead to Pensions Collapse, USD Devaluation, and NWO- http://www.marketoracle.co.uk/Article65715.html ). Thus the FED’s persistent money expansion promoted a huge wealth re-distribution, supported a growing welfare state, further enriched the already wealthy, and destroyed America’s middle class - the base of America’s capitalist republic.
It was only after the failure of mortgage asset-backed securities endangering the crash of global markets that auto and student education loans were actively expanded to fill the credit expansion void. The most recent liquidity expansion is that of a $1 trillion infusion into repo markets for banks and hedge funds. Repo funding can be highly leveraged, as bonds can be re-hypothecated. The fact that this funding expansion was suddenly needed at all demonstrates that regular monetary accommodation no longer suffices to keep markets levitated – so we are closer to the financial avalanche.
Statistics for market performance are strongly influenced by picking the starting and ending points. So for example, if our investment starting point is the nadir of the 2008 market decline in 2009, and the ending point January 1, 2020 the compound rate of return is 13.7% - a fabulous rate. If however, we choose the starting point the top of the market just before the calamitous 2008 decline in 2007, the annual compound return is a much more moderate 4.4%. If one were fortunate to invest at the nadir of the stock market in July of 1982, the rate of investment return till 2020 would be 7.2% - an attractive rate. However, if one made a large singular investment in the stock market in 1971 when the Bretton Woods monetary standard was repealed, that rate of return over the 49 year period would compute to only 3.4%. So entry and exit points make all the difference.
Accordingly, if your investment exit point will be after the next market slide, your investment return will be less than the apparently fabulous rate cited above, and certainly less than the fairytale 29% rate touted for 2019. But it is hard to argue with the fact that FED controlled interest rate increases in the 1970s, and a thirty year subsequent decline has moved markets dramatically, and profoundly affected investor rates of return based on their entry and exit points. For anticipating future returns the question to contemplate is how much longer will the FED be able to issue a global reserve currency, and how much longer will it be able to control interest rates in the future?
Inflation adjusted returns
Let us consider the government’s CPI inflation numbers from 1971, when the gold exchange window was closed creating unbacked fiat dollars for the first time. This new monetary system spawned a dramatic and persistent increase in the creation of dollars and credit, which translates into a long-term reduction in the purchasing value of our currency.
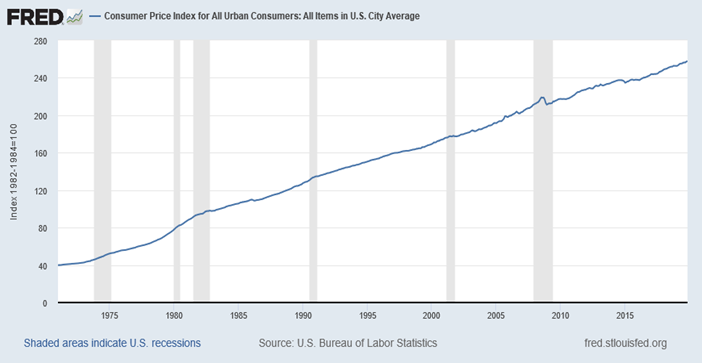
The Federal Reserve of Minneapolis 1971 CPI index was 40.5, and the 2019 CPI index was 255.7, indicating that the purchasing value of a dollar over this time period had declined by 84.2%. This means that a product which requires $1 to purchase today required only $0.15 in 1971. Stating this differently, the cost of this item today is 6.5 times that required in 1971. That 3.9% compound annual rate of decrease in purchasing power since 1971 (48 years) shows an absolutely insane reduction in the FED-manipulated fiat currency value – which over this long term is twice the rate of inflation that the FED proclaims it wants to achieve at present.
Note the near perfect linearity of the CPI chart below, which tells us that regardless of the economic environment, money inflation keeps reducing the purchasing value of our currency at a fairly steady rate. Also, it is well known that government statisticians adjust their formulas – regardless what item is being measured. As an example, CPI rates of inflation were massaged so the COLA (cost of living adjustment) enacted in 1973 for payment increases to Social Security might be minimized.

This reduction in the purchasing value of our currency extends to dollars that investors have gained in financial markets. Adjusting the investment returns in the stock market since 1971 by inflation we find that the real rate of investment return since 1971 was the 3.4% rate cited previously, less the 3.9% annual rate of inflation – resulting in an overall negative rate of -0.5%, before being reduced further by income tax liabilities on capital gains on nominal sums. So yes, entry and exit points are extremely important.
An ounce of gold has risen from $35 an ounce in 1971 to $1560 in 2020, which computes to an annual rate of return of 8.1%. However there is a huge difference between stocks and gold. The inflated nominal stock prices, being in the form of dollar assets, need to be adjusted for reduction in purchasing power. Gold requires no such adjustment, and it gains value (if un-manipulated) as currency value declines. In addition, after major commercial banks paid fines, and a few traders have been convicted for precious metal suppression, the true value of gold may emerge absent the criminal market manipulation. Interestingly, the 8.1% annual price increase in gold since 1971 may actually well reflect the real rate of currency and credit expansion over that period. It does not reflect yet any global reserve currency’s diminishing use or acceptance.
Corporate earnings
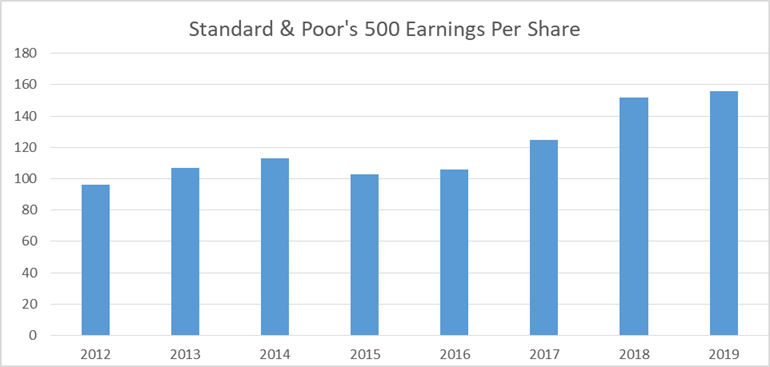
Standard & Poor’s 500 Company Earnings per Share computation has an important influence on stock market prices and its direction. Below we show a chart which depicts the S&P 500 earnings per share from 2012 to 2019, where the 2019 number is the six month earnings annualized. Note, that the EPS numbers do not grow but starting in 2017 they rise, due to president Trump’s tax reduction for corporations from 35% to 21% and allowing for a reduced-tax repatriation of foreign earnings, which then seem simply to reach a higher earnings plateau.

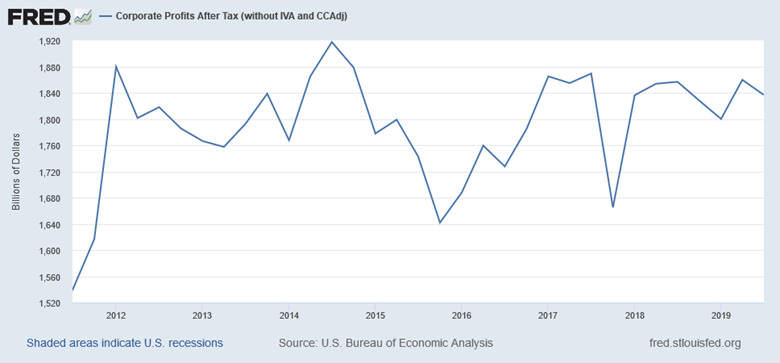
Traditional valuation of securities includes accounting for growth of earnings in a single company - or for the whole economy, when one is evaluating the economic environment of financial markets. It is growing future earnings of companies that drives the stock market, while reduced interest rates magnifies the move. Below is the chart based on FED quarterly data reported as corporate earnings between July 1, 2011 and September 30, 2019. It shows that corporate earnings for a period of eight years was flat. No growth. Eight years!

Of course earnings per share rose somewhat because corporations were borrowing funds to repurchase their shares, which had the effect of increasing reported per share earnings. That is what is called smoke and mirrors. Indeed, the increased borrowings for stock repurchases make corporate capitalizations weaker and riskier, which in a period of rising interest rates could bankrupt some of those same companies.
Thus, the happy view that our economy is doing just fine is false. If the gargantuan financial stimulus by the FED, whereby national debt rises from $10 trillion in 2008 to $23 trillion in 2019 can only produce flat earnings for eight years – we still have a financial crisis!
Historically, war has been the primary driver of national debt. Therefore it is not surprising that America has been a frequent war participant over the last century, ever since the Federal Reserve Bank was established, which was able to finance America’s wars by printing money ex nihilo. But war destroys, it does not build. Only the military-industrial complex owners benefit from this persistent destruction. According to the Watson Institute of International and Public Affairs at Brown University, U.S. wars and military action in Afghanistan, Iraq, Syria and Pakistan have cost American taxpayers $5.9 trillion since they began in 2001.
Let us not be so simple minded as to believe that current budget deficits of $1 trillion, and emergency repo funding at the end of 2019 also of $1 trillion somehow adds up to a healthy, robust economy. We should understand that the present record-high financial markets are an illusion manipulated by the FED. As FOMO is being overtaken by FOPA, the markets will reflect reality. The Minsky moment, whereby a single additional snowflake on the mountainside starts an avalanche approaches.
Tomorrow’s financial markets
Perhaps the most crucial question to be asked by investors is whether tomorrow’s financial markets can continue to rise. Absolutely. As long as the FED keeps liquefying banks, who sequester their funds by directing them into financial markets or keeping funds on deposit at the FED – but not releasing them into the consumer economy – markets can rise without significant consumer price inflation. The price inflation becomes contained solely in financial markets as prices for financial products keep rising, expanding the bubble.
The risk to this continuing outcome comes from the fact that the economy has been exposed to unbridled money expansion, which over the last decade has been increasingly ineffective in creating economic growth. This money expansion has re-distributed wealth away from the middle class, debilitating America’s consumer-driven economy.
It should be recognized that if our dollar is to serve as the global reserve currency it has to satisfy the needs and demands of foreign nations. This need for dollars has been growing as foreign sovereign debt issued in USD needs to be repaid in dollars. And the growing, substantially higher amount of foreign debt creation by banks, relative to dollars created by the FED causes a squeeze on liquidity. Inadequate market liquidity causes market air pockets. Air pockets cause flash crashes, which trigger financial market avalanches. The Minsky moment approaches.
Embracing FOPA as an investment thesis, and exiting from the market now can save one the grief of trying to salvage current gains during an illiquid market decline governed by computer algos. Indeed, thoughtful reflection on the real state of the economy, trend of corporate earnings, future FED limitations, and global dollar financial system stability might convince sage investors to now apply the Au investment thesis.
Since 1971 the stock market has multiplied by a factor of 5.2 times. Gold price over this same time period multiplied 44 times. Since 2012 total corporate earnings have been essentially flat, but the stock market multiplied by 2.3 times. Gold declined from 2012, and is still about 10% lower than it was in 2012. Now with banks and sovereign nations buying gold over the last two years, budget deficits requiring additional FED money expansion, and the FED needing to liquefy banks and hedge funds through repo facilities, gold suppression cannot long last. It does appear that time is right for the Au thesis. The Minsky moment approaches.
Raymond Matison
Mr. Matison was an Institutional Investor magazine top ten financial analyst of the insurance industry, founded Kidder Peabody’s investment banking activities in the insurance industry, and was a Director, Investment Banking in Merrill Lynch Capital Markets. He can be e-mailed at rmatison@msn.com
Copyright © 2020 Raymond Matison - All Rights Reserved
Disclaimer: The above is a matter of opinion provided for general information purposes only and is not intended as investment advice. Information and analysis above are derived from sources and utilizing methods believed to be reliable, but we cannot accept responsibility for any losses you may incur as a result of this analysis. Individuals should consult with their personal financial advisors.
© 2005-2022 http://www.MarketOracle.co.uk - The Market Oracle is a FREE Daily Financial Markets Analysis & Forecasting online publication.


