Gold Stock Investors Looking at Huge Losses
Commodities / Gold & Silver Oct 05, 2008 - 02:42 PM GMTBy: Merv_Burak

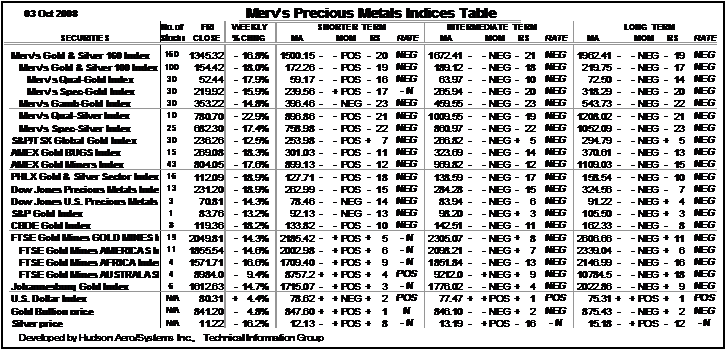
 The magnification factor at work, on the down side. Gold drops less than 5% while gold stocks drop more than 15%. It worked on the up side, now we see it working on the down side. Although a long term bear market in gold bullion may be argued it sure is a bear for stocks with the average stock down 52% since their highs only a few months back.
GOLD : LONG TERM
The long term P&F chart shown last week did break on the up side but promptly reversed and has moved lower. It has broken below two previous lows but ended the week right at the up trend line. This is just short of my dual requirement to break two previous lows AND move below the up trend line. Although I suggested last week that a downside move to $825 would be negative, that only got the price to the line and not below the line. Another few $ move, to $810, is needed to break through the line and give us a new bear signal, P&F wise. Until that happens I must assume the upside break was valid and now has a projection to the $1080 level. A break on the down side would put the previous P&F projection of $630 to $645 in play again.
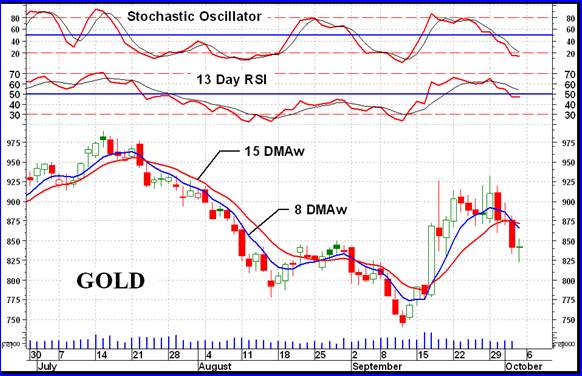
As for the usual indicators, the price of gold is below its negative moving average line and the momentum indicator is sitting on top of its neutral line below its trigger line. The rating has now dropped back to the BEARISH level.
INTERMEDIATE TERM
On the intermediate term the price of gold has once more dropped below its moving average line and the line has turned downward. The momentum indicator has also dropped back into its negative zone and below its negative trigger line. The volume indicator has been showing a significant weakness by dropping below its early Sept lows and remains below its trigger line. All in all the intermediate term can only be classified as BEARISH .
SHORT TERM
On the short term everything has gone negative. The price of gold (using the Dec COMEX contract data) has moved lower and has closed below its negative sloping short term moving average line (15 DMAw). As confirmation of the move the very short term moving average line (8 DMAw) has now moved below the short term line for an indication that the trend is towards lower prices. The momentum indicator (13 Day RSI) has once more moved into its negative zone below its negative trigger line. The short term, as seen on the chart, is definitely downward and the rating is therefore BEARISH .
As for the immediate direction of least resistance, well, that is also towards the down side with the price below its very short term moving average line and the Stochastic Oscillator in its negative zone.

SILVER
Once again silver has shown a greater weakness than has gold, which isn't saying much. I looked through my P&F charts for silver to see if they are giving me any reasonable downside projections. Unfortunately I can calculate three projections varying from $6.50 to $5.00 (the third projection is to the $5.50 level). All three are calculated based upon very well defined P&F patterns so all three are valid. For now I'll take the middle one as the target. That's still far from where we are today so hang on to your hats, the ride may be bumpy. Using a shorter term P&F chart I get an intermediate target of $9.25, which doesn't sound as bad.
PRECIOUS METAL STOCKS
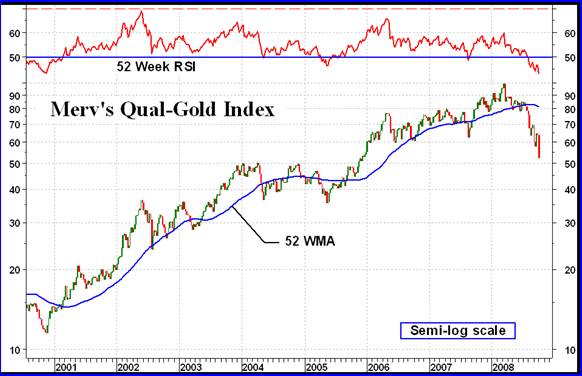
As mentioned in the introduction, the gold and silver stocks have been taking a real drubbing over the past dozen weeks. Although the average of the 160 stocks that I follow in my Merv's Gold & Silver 160 Index dropped 52% during that time one would think that it was primarily the cats and dogs that pushed the Index down. Unfortunately, my Index of 30 of the largest stocks traded on the North American markets, the Merv's Qual-Gold Index, dropped almost as much. It dropped 47% during this period and the much watched PHLX Gold and Silver Sector Index dropped 46%. So it was not just a drop in the lower quality stocks but all gold and silver stocks. THAT is what a bear market is all about, the good go down with the bad.

The Qual-Gold Index dropped decisively through a support level at the 60 mark and is almost at its next support, the 50 level from action during 2004. The Index is now at a point it has not been for almost three years. Although the Index is still ahead some 350% from its previous bear market low in 2000 the unfortunate part is that most precious metal investors probably did not get in until the past few years and are in a loss situation. Now, most gold guru commentators are indicating that gold should soon rise to new all time highs due to the dramatic drop in the world financial condition. I'm just inclined to follow where the charts and indicators take me and if the trend reverses and starts to go up, so be it. I'll be with the trend.
Merv's Precious Metals Indices Table

Let's call it another week.
By Merv Burak, CMT
Hudson Aero/Systems Inc.
Technical Information Group
for Merv's Precious Metals Central
For DAILY Uranium stock commentary and WEEKLY Uranium market update check out my new Technically Uranium with Merv blog at http://techuranium.blogspot.com .
During the day Merv practices his engineering profession as a Consulting Aerospace Engineer. Once the sun goes down and night descends upon the earth Merv dons his other hat as a Chartered Market Technician ( CMT ) and tries to decipher what's going on in the securities markets. As an underground surveyor in the gold mines of Canada 's Northwest Territories in his youth, Merv has a soft spot for the gold industry and has developed several Gold Indices reflecting different aspects of the industry. As a basically lazy individual Merv's driving focus is to KEEP IT SIMPLE .
To find out more about Merv's various Gold Indices and component stocks, please visit http://preciousmetalscentral.com . There you will find samples of the Indices and their component stocks plus other publications of interest to gold investors.
Before you invest, Always check your market timing with a Qualified Professional Market Technician
Merv Burak Archive |
© 2005-2022 http://www.MarketOracle.co.uk - The Market Oracle is a FREE Daily Financial Markets Analysis & Forecasting online publication.
Comments
|
Bruce Blechman
28 Jul 09, 14:50 |
gold stock investors
Do you sell gold stock investors lists ? |


