UK House Prices Predicting the Outcome of General Election 2019
ElectionOracle / General Election 2019 Nov 25, 2019 - 01:04 PM GMTBy: Nadeem_Walayat
Boris Johnson finally managed to persuade a frightened of the electorate Labour party to agree to hold a snap UK general election on the 12th of December 2019. An election that Johnson originally planned to hold Mid October ahead of the 31st October Brexit deadline, but extreme paralysis that has been the state of Westminster since June 2017 dragged out the painful process for another couple of months as Britain missed yet another Brexit deadline.
The latest poll of opinion polls (BBC) puts the the Tories on 41%, Labour on 29% and the Lib Dems on 15% with the trend in the Tories favour which the pollsters continue to go onto extrapolate into the Tories winning the election typically on a majority of over 70 seats as illustrated by https://www.electoralcalculus.co.uk
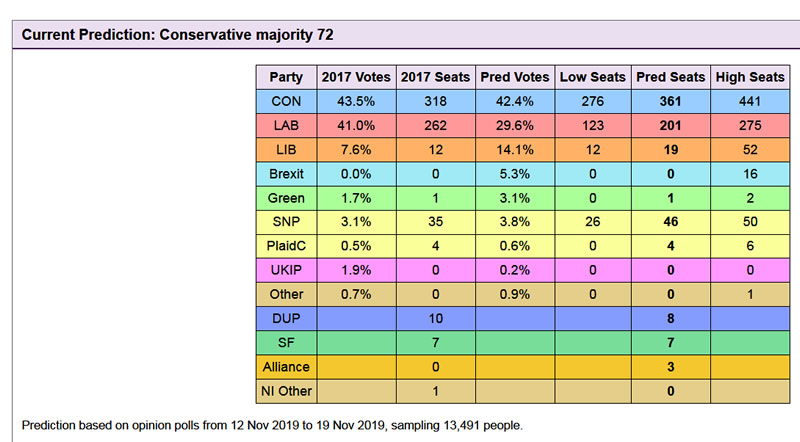
Only one problem, we've been here BEFORE!
DEJA VU ! We have been here EXACTLY BEFORE ! As electoral calculus forecast from the day BEFORE the 2017 June 8th election illustrates that was typical of pollster forecasts.
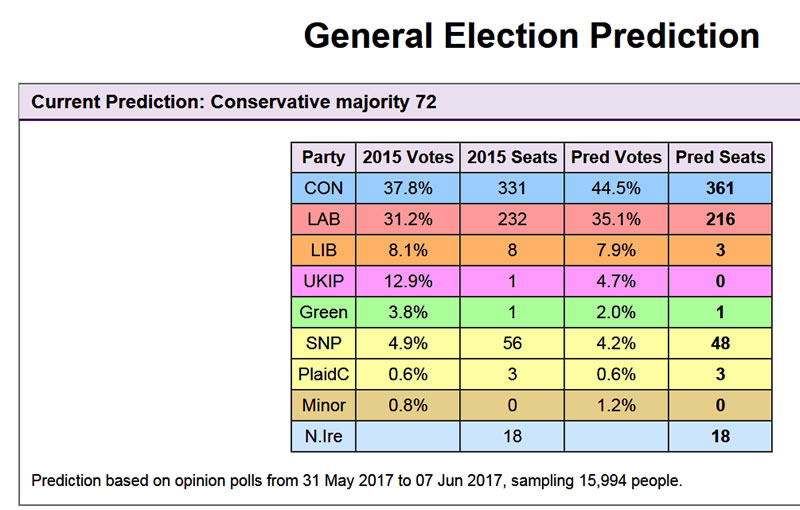
So as Theresa May would say "Nothing has Changed, Nothing HAS CHANGED" Cut and paste opinion polling, cut and past forecasts, and likely a cut and past outcome! ALL of the opinion pollsters without exception got the 2017 general election very badly wrong, just as they had 2015 and 2010! Not to mention the EU referendum when on the night the polls called Yougov called it for REMAIN on 52% to 48% LEAVE.
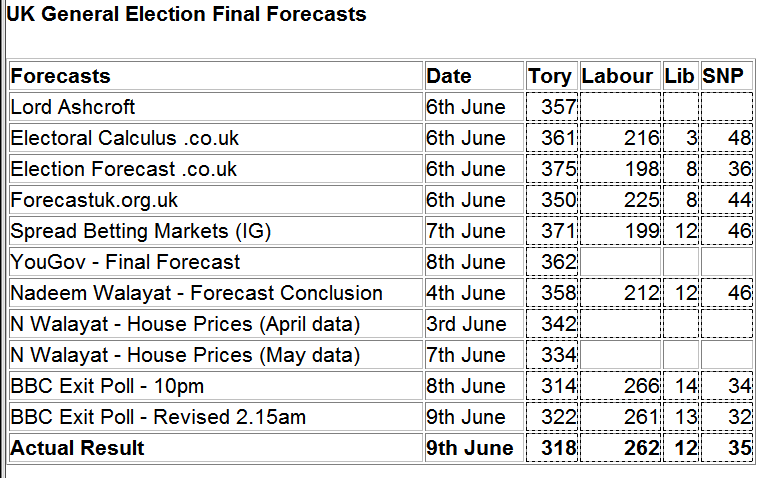
So just like 2017, 2019 is supposedly predictable, a definite shoe in for the Tories. Maybe they will get this one right, after all they have been wrong 4 times in a row, even a coin toss is right 50% of the time!
You know how it goes, if everyone's betting on one market direction than more likely than not the outcomes going to be in the opposite direction.
UK House Prices the Most Accurate Predictor of UK General Elections
My post post 2017 election analysis concluded in 9 key lessons learned for next time which reiterated UK house prices as being the most significant single predictor for UK general elections.
https://youtu.be/qL2sTLpeCGI (20 mins)
GE 2015
The polling establishment and the mainstream media had in unison proclaimed the 2015 general election was too close to call, one where the Labour and Conservative parties were neck and neck and where even if the Conservatives managed to pull a handful of seats ahead would still lose by default as they would not be able to form a majority even with Lib Dem support and therefore the Labour party appeared destined to win the 2015 general election, all of which was based on a year of opinion polls that consistently presented this consensus view right up until the polls closed!
As a reminder the consensus was for the Conservatives to win just 270 seats, where even the BBC's exit poll AFTER the polls closed at 10pm proved WRONG by forecasting the Conservatives would FAIL to win an outright majority on 316.
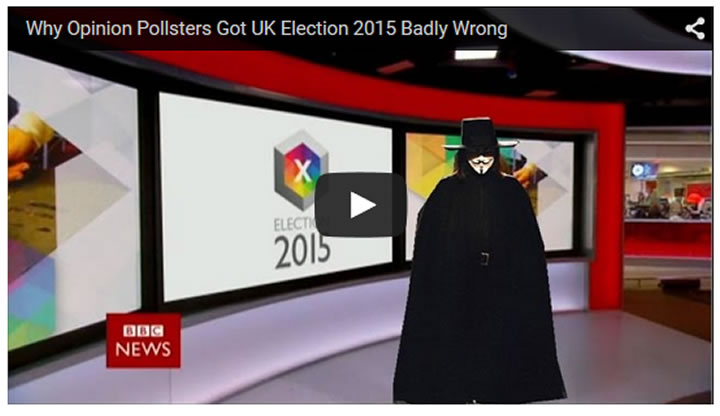
Instead, the reality proved to be the exact opposite as instead of the Ed Milliband walking into No 10 we had David Cameron racing back to No 10 before the locks were changed and where this video explained in detail why the opinion pollsters got the UK general election 2015 so badly wrong which was contrary to my long-standing expectations for a probable Conservative outright election win.
UK House Prices Accurately Forecast 2015 Election Result
My market skewed perception had accurately forecast the outcome of the UK General Election based on my house prices trend trajectory forecast a good 18 months BEFORE voting day!
30 Dec 2013 - UK House Prices Forecast 2014 to 2018, Inflation, Trend Trajectory and General Election 2015
UK General Election Forecast 2015
In terms of the 'fixed' May 2015 general election, the implications of 10% per annum house price inflation for another 18 months, that builds on the housing bull market of the previous 12 months and on the embryonic bull market of 2012 are that probability strongly favours an outright Conservative election victory.
The following graph attempts to fine tune the outcome of the next general election by utilising the more conservative current house prices momentum of 8.5% which has many implications for strategies that political parties may be entertaining to skew the election results in their favour.
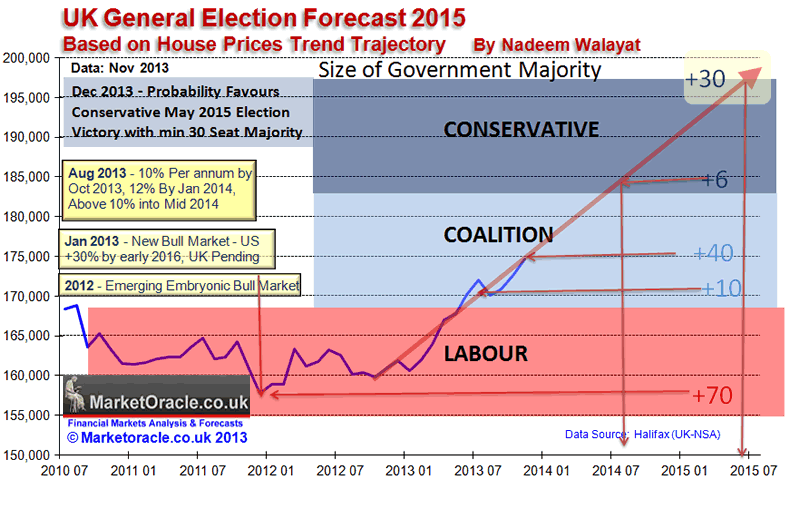
In conclusion a May 2015 general election at an average house price inflation rate of 8.5% would result in a Conservative overall majority of at least 30 seats. Therefore this is my minimum expectation as I expect UK house prices to start to average 10% per annum from early 2014 with my actual forecast converging towards average UK house prices breaking to a new all time high just prior to the May 2015 general election which would be a significant boost for housing market sentiment and thus the Conservative's election prospects.
UK General Election - 2017
My UK house prices momentum analysis warned that expectations for a larger Tory majority was unlikely to materialise, instead the Tories were likely at best to gain as few as 10 seats.
UK House Prices Forecast General Election 2017 Conservative Seats Result
UK House Prices General Election Forecast
In terms of the forecast outcome, then it would have been marginally better to have the May house prices data which unfortunately won't be released until the 7th of June. However, indications from other indices such as Nationwide are that house prices were little changed for May.
The key drivers of the house prices positive or negative wealth effect in this election are UK house prices over the following time periods.
| Year to April 2017 | +2.6% |
| Year to April 2016 | +7.8% |
| 4 year bull market average | +9.2% |
| Weighted average | +5.4% |
The weighted average is in favour of the most recent data as having the most impact on voter behaviour.
Considering the 2 key UK house price momentum averages gong into the election of +2.6% for the year to date and +5.4% for the weighted average. Then these are net positives for the incumbent party i.e. the Conservative government 'should' increase its seats majority.
However, house price momentum is FALLING so over the passage of time since the EU referendum the potential size of the increase in the Conservative majority has been gradually eroding i.e. it would have been much better for Theresa May to have called the election 6 months ago for say December or January when house prices momentum was rising towards 7% rather than for June 2017.
So the decline in house price momentum will result in a significant reduction in the size of the Conservative majority that will likely be nowhere near the likes of the 400+ seats that many in the mainstream press were bandying about just a couple of weeks ago!
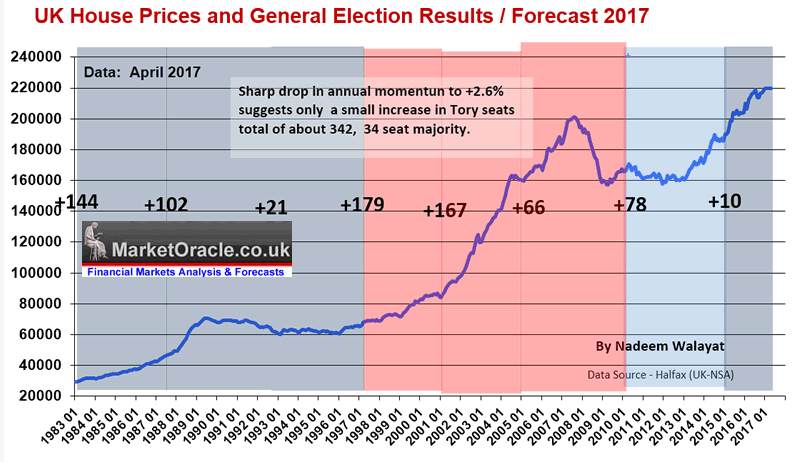
Therefore UK house prices momentum is forecasting barely a dozen seat increase the Conservatives seats total from 330 to about 342 seats that converts into a Commons majority of 34, which again is a far cry from the 100+ seat majority that some still persist on.
Forecasting the UK General Election 2019
So at the core of my extensive UK general election analysis is what the UK housing market is saying in terms of the probable outcome of the UK general election. Will Boris Johnson get his "Get Brexit Done" majority, or will Corbyn go into coalition with the Scottish Independence Fanatics who are hell bent on seeing Scotland commit suicide that would make issues such as the Northern Ireland border look like a picnic.
This is my first in a series of 6 pieces of in-depth analysis to conclude in a detailed seats per party forecast for the December 12th UK General Election that I aim to complete by the 3rd of December.
UK General Election 2019 Analysis Schedule
- UK House Prices Momentum General Election Forecast
- Debt Fuelled Voter Spending Bribes
- UK economy Current State
- Marginal Seats, Social Mood and Momentum
- Opinion Polls and Betting Markets
- UK General Election Forecast Conclusion and Market Opportunities.
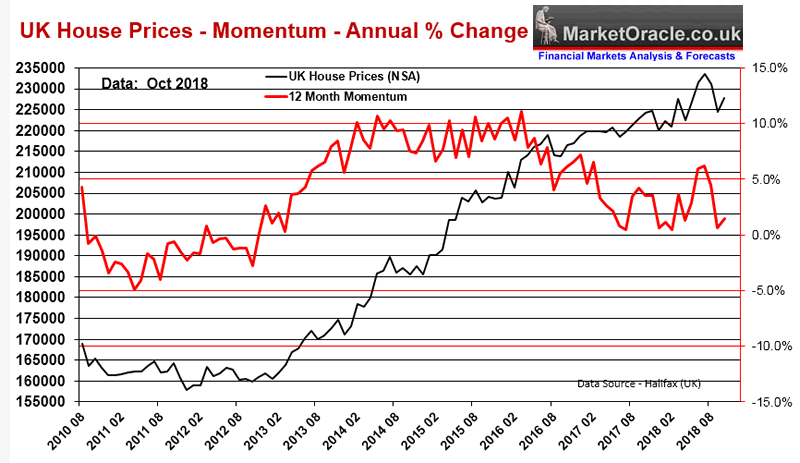
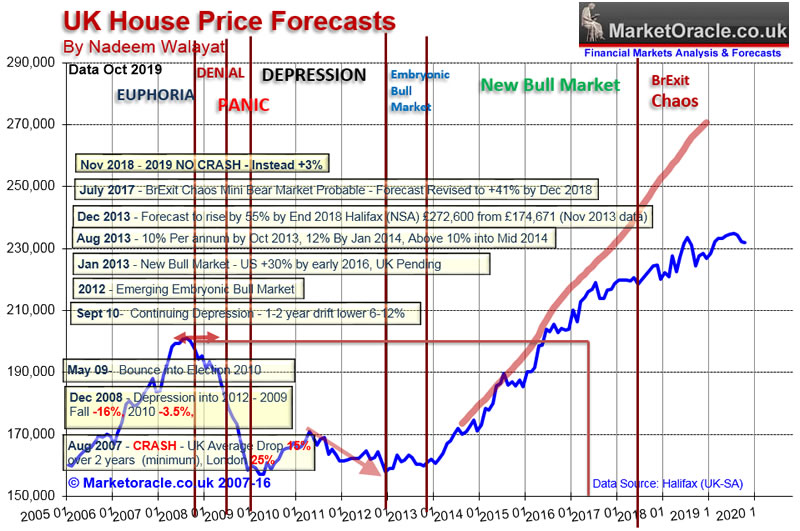
It is now over a year since I last looked at UK house prices momentum ( November 15th 2018 Tory BrExit Chaos Cripples UK House Prices Bull Market - Momentum Analysis). Where whilst Westminister being paralysed as a consequence of Brexit chaos, nevertheless warned to ignore establishment fear propaganda at the time ahead of the then EU Exit date of 29th of March 2019, fear mongering right from the Bank of England downwards with Mark Carney literally warning of 35% CRASH in UK house prices during 2019. Instead momentum analysis concluded in expectations for a mild gain of about 3% for the year.
UK House Prices 2019
Current UK house prices momentum coupled with the government and central banks hidden hand suggests to expect average UK house price inflation of about 3% for at least the first half of 2019 and likely for the whole of the year. Where the current trajectory is for UK house prices to peak at about 4% to coincide with BrExit day 29th March 2019 before dipping back towards zero over the subsequent months. Compare this to the likes of Bank of England Governor Mark Carney warning just a few weeks ago that UK house prices could fall by as much as 35% in a No deal BrExit! Regardless of what happens in terms of a deal or No deal BrExit a 35% drop is NOT going to happen! Most probable for 2019 is an average gain of about 3%, which I will fine tune further over the next few weeks.
So a year on, and all of the doom in the run up to the start of 2019 and since, the UK house prices graph shows that average prices have NOT CRAHED by 25%! But instead trended inline with my expectations towards a net gain of about 3% on release of December data. With house prices currently standing up on the year at +2.3%.
The rest of this analysis has first been made available to Patrons who support my work - UK House Prices Momentum General Election Results Forecast
So for immediate First Access to ALL of my analysis and trend forecasts then do consider becoming a Patron by supporting my work for just $3 per month. https://www.patreon.com/Nadeem_Walayat.
Your Analyst
Nadeem Walayat
Copyright © 2005-2019 Marketoracle.co.uk (Market Oracle Ltd). All rights reserved.
Disclaimer: The above is a matter of opinion provided for general information purposes only and is not intended as investment advice. Information and analysis above are derived from sources and utilising methods believed to be reliable, but we cannot accept responsibility for any trading losses you may incur as a result of this analysis. Individuals should consult with their personal financial advisors before engaging in any trading activities.
Nadeem Walayat has over 30 years experience of trading derivatives, portfolio management and analysing the financial markets, including one of few who both anticipated and Beat the 1987 Crash. Nadeem's forward looking analysis focuses on UK inflation, economy, interest rates and housing market. He is the author of five ebook's in the The Inflation Mega-Trend and Stocks Stealth Bull Market series that can be downloaded for Free.
 Nadeem is the Editor of The Market Oracle, a FREE Daily Financial Markets Analysis & Forecasting online publication that presents in-depth analysis from over 1000 experienced analysts on a range of views of the probable direction of the financial markets, thus enabling our readers to arrive at an informed opinion on future market direction. http://www.marketoracle.co.uk
Disclaimer: The above is a matter of opinion provided for general information purposes only and is not intended as investment advice. Information and analysis above are derived from sources and utilising methods believed to be reliable, but we cannot accept responsibility for any trading losses you may incur as a result of this analysis. Individuals should consult with their personal financial advisors before engaging in any trading activities.
Nadeem Walayat Archive |
© 2005-2022 http://www.MarketOracle.co.uk - The Market Oracle is a FREE Daily Financial Markets Analysis & Forecasting online publication.


