


US Non-Farm Payroll Jobs Contract for 9th Consecutive Month
Economics / US Economy Oct 03, 2008 - 12:32 PM GMTBy: Mike_Shedlock

 Before taking a look at the monthly jobs data, let's take a look at weekly claims. The US Department of Labor is reporting Initial Unemployment Insurance Claims continue to rise.
Seasonally Adjusted
In the week ending Sept. 27, the advance figure for seasonally adjusted initial claims was 497,000, an increase of 1,000 from the previous week's revised figure of 496,000. It is estimated that the effects of Hurricane Gustav in Louisiana and the effects of Hurricane Ike in Texas added approximately 45,000 claims to the total. The 4-week moving average was 474,000, an increase of 11,500 from the previous week's unrevised average of 462,500.
Unadjusted
The advance number of actual initial claims under state programs, unadjusted, totaled 390,837 in the week ending Sept. 27, a decrease of 7,233 from the previous week. There were 255,431 initial claims in the comparable week in 2007.
Jobs Decline 9th Consecutive Month
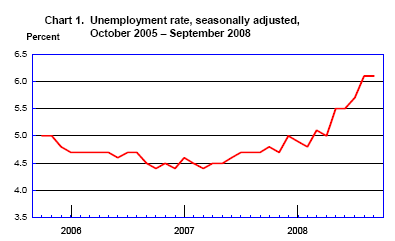
This morning, the Bureau of Labor Statistics (BLS) released the August Employment Report . Jobs were negative for a 8th consecutive month. My target of 6% or higher stated unemployment by the end of the year, made in December 2007 when the unemployment rate was 4.8% was reached last month. In December I also predicted a jobs disaster every month this year. That prediction is now 9 for 9.
Here is a synopsis of the BLS report.
Nonfarm payroll employment declined by 159,000 in September, and the unemployment rate held at 6.1 percent, the Bureau of Labor Statistics of the U.S. Department of Labor reported today. Employment continued to fall in construction, manufacturing, and retail trade, while mining and health care
continued to add jobs.
Establishment Data
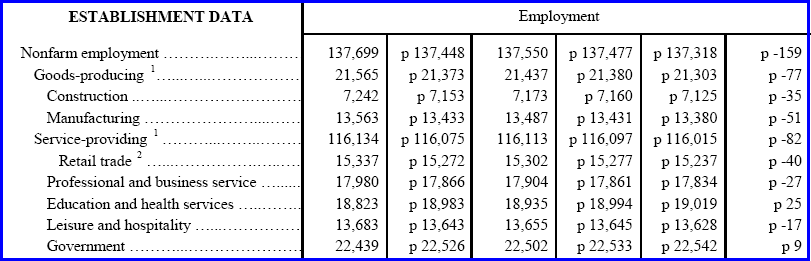
Highlights
- 35,000 construction jobs were lost
- 51,000 manufacturing jobs were lost
- 40,000 retail trade jobs were lost
- 82,000 service providing jobs were lost
- 27,000 professional and business services jobs were lost
- 25,000 education and health services jobs were added
- 17,000 leisure and hospitality jobs were lost
- 09,000 government jobs were added
These are clearly recession totals.
Birth/Death Model In Outer Space
Once again was a very weak jobs report. And once again the Birth/Death Model assumptions are absurd. In July the birth/death adjustments were back in orbit somewhere near Mars. Last month they returned to deep outer space where they have been every month this year except for January and July.
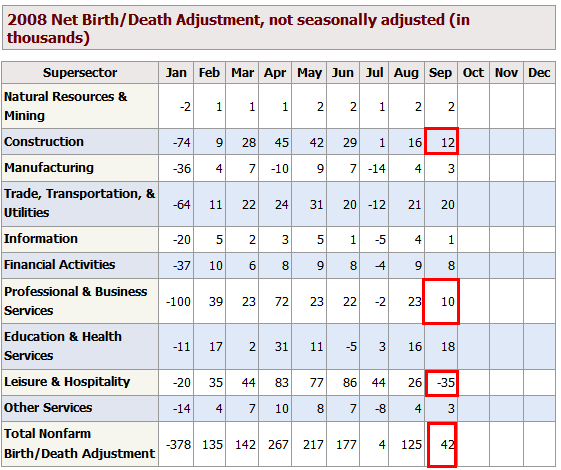
Every month I say the same nearly the same thing. The only difference is the numbers change slightly. Here it is again: The BLS should be embarrassed to report this data.
However, there is a startling difference this month. The Birth-Death Model shows that leisure and hospitality jobs are contracting for the first time since January.
Otherwise, repeating what I have been saying for months now, virtually no one can possibly believe this data. The data is so bad, I doubt those at the BLS even believe it. But that is what their model says so that is what they report.
There is simply no way in a real estate crash that net new construction businesses are added. Note that are there net new professional and business services when mortgage and financial activity is collapsing.
A quick check on the Mortgage Lender Implode-O-Meter shows that 287 Major US lending operations have imploded. The best thing we can say is the rate of change in the mortgage lending implosions is improving. Last month the total was 280, this month it increased slightly to 287. However, even if fewer lenders are going under, there is still decreasing activity in the sector and many small 1-5 person shops that have to be throwing in the towel. Those small 1-5 person businesses are not properly accounted for in the Birth-Death Model in my estimation.
BLS Black Box
For those unfamiliar with the birth/death model, monthly jobs adjustments are made by the BLS based on economic assumptions about the birth and death of businesses (not individuals). Those assumptions are made according to estimates of where the BLS thinks we are in the economic cycle.
The BLS has admitted however, that their model will be wrong at economic turning points. And there is no doubt we are long past an economic turning point.
Here is the pertinent snip from the BLS on Birth/Death Methodology.
- The net birth/death model component figures are unique to each month and exhibit a seasonal pattern that can result in negative adjustments in some months. These models do not attempt to correct for any other potential error sources in the CES estimates such as sampling error or design limitations.
- Note that the net birth/death figures are not seasonally adjusted, and are applied to not seasonally adjusted monthly employment links to determine the final estimate.
- The most significant potential drawback to this or any model-based approach is that time series modeling assumes a predictable continuation of historical patterns and relationships and therefore is likely to have some difficulty producing reliable estimates at economic turning points or during periods when there are sudden changes in trend.
The important point in this mess is that both the job data and employment data are much worse than appears at first glance (and the first glance looked horrid).
Table A-12
Table A-12 is where one can find a better approximation of what the unemployment rate really is. Let's take a look
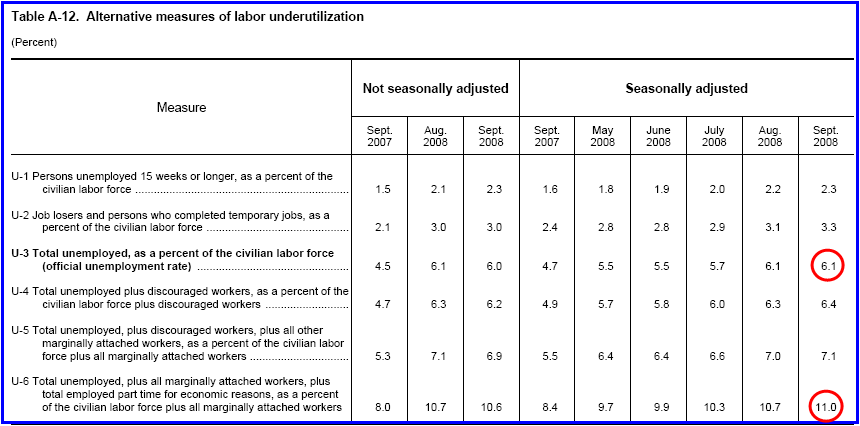
I predicted privately that unemployment would rise this month by .2% to .4%. The official rate was flat. However, if you start counting all the people that want a job but gave up, all the people with part-time jobs that want a full-time job, etc., you get a closer picture of what the unemployment rate is. That number is in the last row called U-6. It reflects how unemployment feels to the average Joe on the street. For the first time U-6 hit 11%. Note that it was 8.4% a year ago. Both U-6 and U-3 (the so called "official" unemployment number) are poised to rise further. And as noted earlier, my 6% target by the end of the year for the official number was reached in August.
Looking ahead, I expect the service sector to continue to weaken. Mall vacancy rates are rising and a huge contraction in commercial real estate is finally started. There is no driver for jobs and states in forced cutback mode are making matters far worse.
Mass Layoffs Rise
One measure of future unemployment can be found by looking at mass layoff announcements. These are mass layoffs that have been announced, and are coming down the road, but are not yet reflected in the unemployment numbers. Please note that U.S. September Job Cuts Rise 33% From Year Ago, Challenger Says
Job cuts announced by U.S. employers climbed 33 percent in September from a year earlier, led by reductions at computer- and automakers, according to a private placement firm.
Firing announcements rose to 95,094 last month from 71,739 in September 2007, Chicago-based Challenger, Gray & Christmas Inc. said in a statement today. Hewlett-Packard Co., the world's largest computer-maker, said last month it would eliminate 24,600 jobs, accounting for much of September's increase, Challenger said. Economic data continues to suggest the Credit Crunch Has Reached Critical Mass and is rapidly picking up steam. Unemployment is poised to soar still higher. There is no driver for jobs, nor will the misguided $700+ billion bailout plan of Paulson provide any.
By Mike "Mish" Shedlock
http://globaleconomicanalysis.blogspot.com
Click Here To Scroll Thru My Recent Post List
Mike Shedlock / Mish is a registered investment advisor representative for SitkaPacific Capital Management . Sitka Pacific is an asset management firm whose goal is strong performance and low volatility, regardless of market direction.
Visit Sitka Pacific's Account Management Page to learn more about wealth management and capital preservation strategies of Sitka Pacific.
I do weekly podcasts every Thursday on HoweStreet and a brief 7 minute segment on Saturday on CKNW AM 980 in Vancouver.
When not writing about stocks or the economy I spends a great deal of time on photography and in the garden. I have over 80 magazine and book cover credits. Some of my Wisconsin and gardening images can be seen at MichaelShedlock.com .
© 2008 Mike Shedlock, All Rights Reserved
Mike Shedlock Archive |
© 2005-2022 http://www.MarketOracle.co.uk - The Market Oracle is a FREE Daily Financial Markets Analysis & Forecasting online publication.