What Has Freaked Out The US Fed?
Interest-Rates / US Interest Rates Oct 31, 2019 - 04:53 PM GMTBy: Chris_Vermeulen
 The US Fed cut rates again by 25 basis points, the third time this year. Prior to the start of 2019, the US Fed gave guidance that 3 to 4 more rate increases were planned for 2019. What the heck happened to the US Fed and what has them so freaked out that they completely changed direction on their expectations for the US and Global economy so quickly? Source: Yahoo Finance
It is painfully obvious to anyone paying attention that the US Fed expected the many years of near-zero interest rates between 2009 and 2015 to act as a fuel for future growth. The problem was that no real growth materialized until just before the 2016 US Presidential elections – and even that was relatively muted. The US Dollar had continued to rally from July 2011 lows well into the 2016 election date. The expectations for the US economy hinged on who won the election. After President Trump won, the markets started an immediate rally expecting business-friendly policies and government.
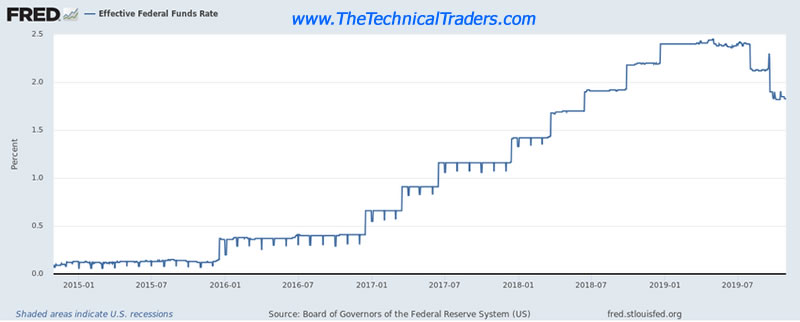
The US Fed had only risen rates to a level of 0.41% FFR by the date of the 2016 elections – basically nothing. After the US presidential election, the US Fed raised rates continually for a total of a 600% rate increase from the November 2016 election date rates. Rates peaked near 2.40% – more than 2400% from the lowest rate levels in 2014/2015.
Our researchers believe the overnight Repo shortages are a very clear sign that US and foreign markets may be trapped in a US dollar shortage and completely over-leveraged in risky debt that may be hanging just overhead for all of us. The US Fed’s ZIRP policy created a massive debt/credit expansion in foreign markets where one could borrow US Dollars for 0%, deploy that capital in foreign markets that were generating 6% to 15% or more over very short terms (12 to 24 months) and as long as the US Dollar did not increase in value dramatically and/or the foreign local currencies did not collapse – it was easy to see how one could take advantage of this situation – possibly too easy.
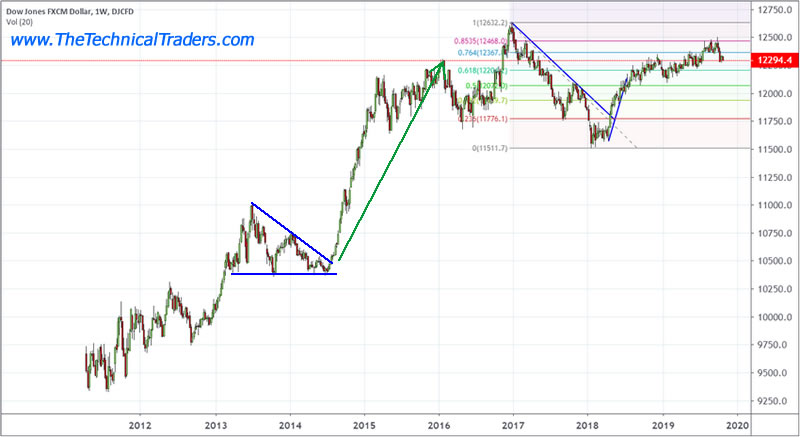
Dollar Index Weekly Chart Trend
But what happened in 2013/2013 that may have caught everyone by surprise? The US Dollar had risen enough to start to raise some eyebrows before 2013. Near the middle of 2014, right before China initiated capital controls, the US Dollar started a rally that ran nearly 18% into 2016. This rally, disrupted the US Dollar carry trade and created a real concern for traders if foreign currencies and/or economies started collapsing. As long as that did not happen, then these borrowers could manage the debt and risk. If this collapse did happen, then the entire house of cards may start to collapse and the foundations may be shaken.

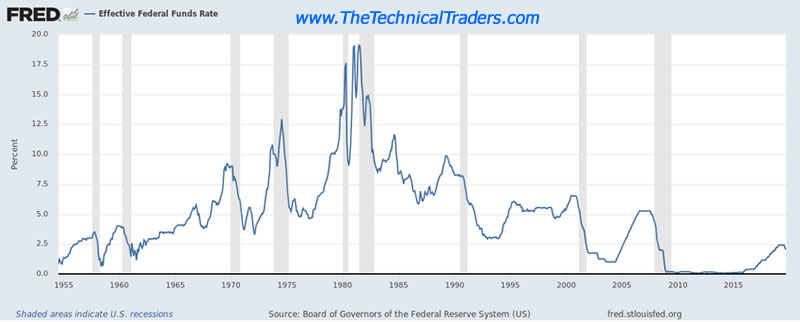
Long Term Fed Rate Trends
The US Fed, in 2015/2016, initiated a rate increase process expecting the strength of the US Dollar to help carry the moderate rate increases and help to propel new US growth. President Trump winning the 2016 elections added to growth expectations as the US stock market rallied to new all-time highs in 2017 while the US Dollar slid from early 2017 highs and rotated lower. The US Fed continued a constant rate increase policy all the way through this rotation, while China and other foreign markets began to rotate, and while the US stock market rotated lower in February 2018.

More Recent Fed Funds Rate Trend
One really has to question what is now causing the US Fed to be much more cautious throughout 2019 and why the sudden change in expected rate policy? Has something changed across global banking that we are unaware of? Has a risk level intensified that we are not noticing? A 2400% rate increase from near ZERO rates in unprecedented – HISTORIC. Our own modeling systems suggested the US Fed had raised rates well beyond upper boundary levels in 2018 when they crossed above the 1.75% & 2.0% levels. Maybe the US Fed is reading our research and following our modeling system’s expectations? Or maybe the US Fed has identified some risk factors that they are trying to contain and prevent – like the overnight Repo issues recently?

Either way, this move by the US Fed to move interest rates lower 12+ months before a US Presidential election should be a fairly clear warning that the Fed believes the next few months/years of trading may be far more volatile than we can imagine. The three rate decreases indicate the Fed was nearly a full 1% above rate levels that believe to be efficient for the markets – Yikes!
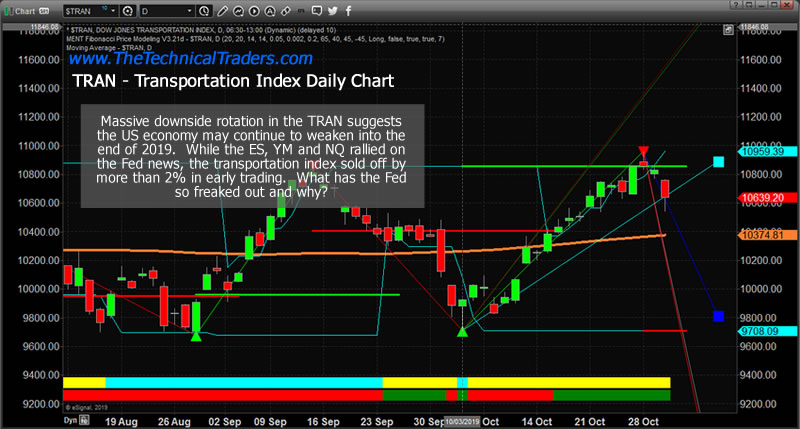
Daily Transportation Index Chart
The Transportation Index rotated downward nearly 2% today after our warning of a classic Japanese Candlestick top formation. This Index typically leads the markets as it is a future measure of economic activity. Further downside price activity in the TRAN would indicate that traders believe the US and global economy is going to continue to weaken. A couple of days ago we talked about the transports sector topping and we nailed this week’s pullback/top yet again.
We believe the only thing driving the US stock market higher at this time is a capital shift initiated by foreign investors seeking safety and security away from local currencies and local stock markets as they continue to pour capital into the US markets.

Concluding Analysis
It’s like we are living on the edge right now. Unless consumers decide to become very active in the US economy and a renewed growth spurt takes place over the next 12+ months, prior to the US Presidential election, the markets will likely become more and more volatile and the potential for very big price swings. The way the US political fight is shaping up, we can’t see any real certainty or calm in the markets other than foreign investors stuffing money into the US markets trying to avoid risks from their local markets/currencies.
Now is the time to understand risks and play it safe. The US Fed is moving rates lower for a reason and that reason is most likely fear of some risk contagion that we are unaware of at the moment. The end of 2019 is almost certain to be much more volatile than one can imagine. Be prepared.
I urge you visit my Wealth Building Newsletter and if you like what I offer, join me with the 1-year subscription to lock in the lowest rate possible and ride my coattails as I navigate these financial markets and build wealth while others lose nearly everything they own during the next financial crisis. Join Now and Get a Free 1oz Silver Bar!
Chris Vermeulen
www.TheTechnicalTraders.com
Chris Vermeulen has been involved in the markets since 1997 and is the founder of Technical Traders Ltd. He is an internationally recognized technical analyst, trader, and is the author of the book: 7 Steps to Win With Logic
Through years of research, trading and helping individual traders around the world. He learned that many traders have great trading ideas, but they lack one thing, they struggle to execute trades in a systematic way for consistent results. Chris helps educate traders with a three-hour video course that can change your trading results for the better.
His mission is to help his clients boost their trading performance while reducing market exposure and portfolio volatility.
He is a regular speaker on HoweStreet.com, and the FinancialSurvivorNetwork radio shows. Chris was also featured on the cover of AmalgaTrader Magazine, and contributes articles to several leading financial hubs like MarketOracle.co.uk
Disclaimer: Nothing in this report should be construed as a solicitation to buy or sell any securities mentioned. Technical Traders Ltd., its owners and the author of this report are not registered broker-dealers or financial advisors. Before investing in any securities, you should consult with your financial advisor and a registered broker-dealer. Never make an investment based solely on what you read in an online or printed report, including this report, especially if the investment involves a small, thinly-traded company that isn’t well known. Technical Traders Ltd. and the author of this report has been paid by Cardiff Energy Corp. In addition, the author owns shares of Cardiff Energy Corp. and would also benefit from volume and price appreciation of its stock. The information provided here within should not be construed as a financial analysis but rather as an advertisement. The author’s views and opinions regarding the companies featured in reports are his own views and are based on information that he has researched independently and has received, which the author assumes to be reliable. Technical Traders Ltd. and the author of this report do not guarantee the accuracy, completeness, or usefulness of any content of this report, nor its fitness for any particular purpose. Lastly, the author does not guarantee that any of the companies mentioned in the reports will perform as expected, and any comparisons made to other companies may not be valid or come into effect.
Chris Vermeulen Archive |
© 2005-2022 http://www.MarketOracle.co.uk - The Market Oracle is a FREE Daily Financial Markets Analysis & Forecasting online publication.


