A Look at Peak Debt
Interest-Rates / Global Debt Crisis 2019 Oct 22, 2019 - 01:34 PM GMTBy: Harry_Dent

 David Stockman, Dr. Lacy Hunt and I agreed on a lot of things last week at the seventh annual Irrational Economic Summit in D.C.
In the September issue of Boom & Bust, I talked about corporate debt being the greatest threat globally this time around. The worst is in the emerging world that used cheap printed dollars from the developed countries, primarily the U.S., to fund a debt binge concentrated in the corporate sectors. But our corporate sector also added a lot to their debt and only 39% of their bonds are investment grade, with 39% BBB and 22% junk.
Last time the bigger binge was by consumers playing the great housing bubble. With low rates and a good economy, why not buy a bigger house, or a vacation house, or speculate in a few to rent out and/or flip.
Consumer Debt
So, I’ll start with consumer debt and a slide from David Stockman’s presentation at our recent IES conference in D.C.

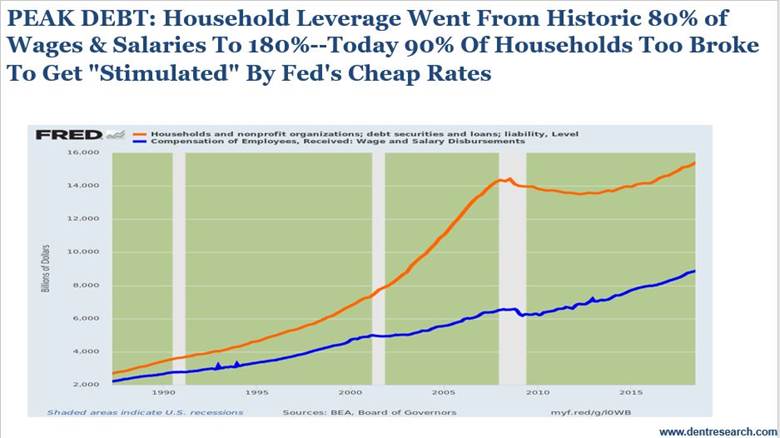
Stockman remarked that consumers had transitioned from a more historical level of debt leverage of 80% up to 180%. In this chart, total consumer debt has grown 505% today at $15.5T (trillion) from its $2.6T in 1987. In the 13 years up until 2000, it grew 162% to $6.8T.
Then the real bubble hit starting in 2000 when stocks crashed and people switched to speculation in real estate . Their debt grew 112% in just 8 years to $14.4T in 2008. It backed off with minor deleveraging to $13.5T in 2012 and then grew a much more sober 17% into now, 2019
Hence, households have not been the big borrowers this time around.
The Corporate Side

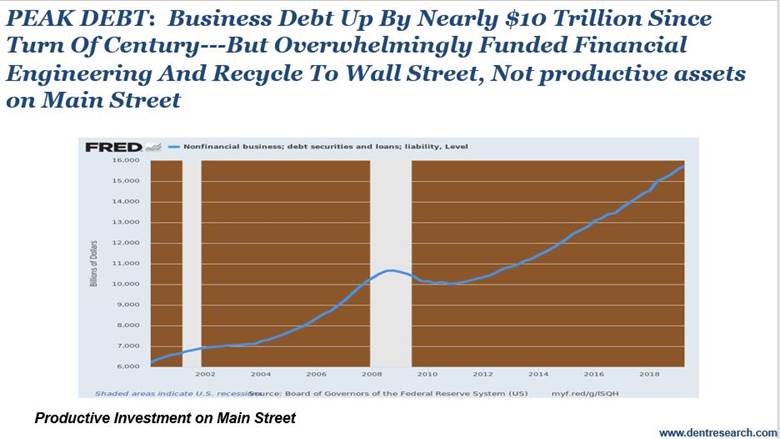
This chart goes back to 2000. In the last bubble corporate debt went from $6.2T in 2000 to $10.6 in 2008, up 71% and less than that 112% for consumers. That debt fell modestly to $10.0T and then grew a not sober 57% to $15.7T. It is now near total consumer debt at $15.8.
But the growth rate since 2000 has been higher overall for the corporate sector, 153% vs. 132% for consumers.
Again, consumer debt grew more from 2000 to 2008 and corporate debt more from 2010 to 2019. Consumers speculated more on housing in the first bubble and corporations did worse this time around. They speculated on their own stocks: $5.7T since 2009! Oh, that’s the exact amount of the net debt increase since then.
Housing fell 34% last time and could fall closer to 50% this time. But those corporate stocks could fall 80%+. How foolish the corporate CEOs and boards will look… the dumbest money in history – not for shoe shine boys anymore.
So, who’s going to be more in trouble this time around with 61% of their corporate bonds not investment grade – BBB or less including 22% junk bonds?
Harry
Follow me on Twitter @HarryDentjr
P.S. Another way to stay ahead is by reading the 27 simple stock secrets that our Seven-Figure Trader says are worth $588,221. You’ll find the details here.
Harry studied economics in college in the ’70s, but found it vague and inconclusive. He became so disillusioned by the state of the profession that he turned his back on it. Instead, he threw himself into the burgeoning New Science of Finance, which married economic research and market research and encompassed identifying and studying demographic trends, business cycles, consumers’ purchasing power and many, many other trends that empowered him to forecast economic and market changes.
Copyright © 2019 Harry Dent- All Rights Reserved Disclaimer: The above is a matter of opinion provided for general information purposes only and is not intended as investment advice. Information and analysis above are derived from sources and utilising methods believed to be reliable, but we cannot accept responsibility for any losses you may incur as a result of this analysis. Individuals should consult with their personal financial advisors.
© 2005-2022 http://www.MarketOracle.co.uk - The Market Oracle is a FREE Daily Financial Markets Analysis & Forecasting online publication.


