


USO United States Oil Fund Longer Term Cycles & Elliott Wave
Commodities / Crude Oil Oct 09, 2019 - 08:25 AM GMT

Firstly the USO instrument inception date was 4/10/2006. CL_F Crude Oil put in an all time high at 147.27 in July 2008. USO put in an all time high at 119.17 in July 2008 noted on the monthly chart. The decline from there into the February 2009 lows was in three swings. An a-b-c in red although it was a very steep pullback.
The bounce from the 2009 lows is a complex double three combination with a triangle “y”. This is w-x-y in red to end the blue wave (x). In either a bullish or bearish market this particular structure always makes a high or low in the initial wave “w”. Structures like this will be followed by a contracting or running triangle. In this case the structure ended in June 2014. The decline from those highs were very sharp again. However, this was in three swings again a-b-c in red to end the blue wave (y). This completed a three swing correction (w)-(x)-(y) in blue from the July 2008 highs. That is labeled ((b)) in black at the February 2016 lows.
The analysis continues below the USO Monthly chart.
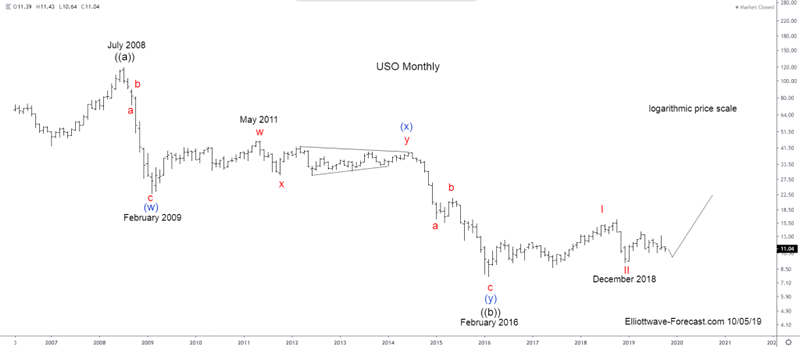
Secondly CL_F Crude Oil and the USO instrument as previously mentioned made an all time high back in July 2008 then each of them appears to have declined in three big swings into the February 2016 lows. In the case of USO the price was 7.67. The momentum indicators suggest the bounce into the 2018 highs was strong. This suggests it had ended the cycle lower from the all time highs in 2016. Thus I presume those lows will hold long term.
The analysis continues below the USO Weekly chart.
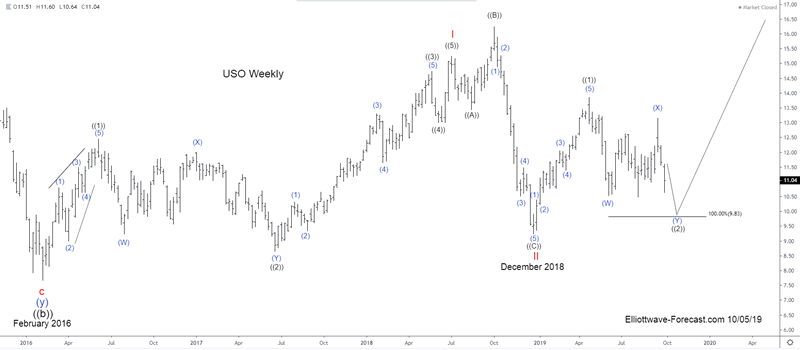
In conclusion: As the USO mirrors CL_F Crude Oil, the bounce from the February 2016 lows into the 2018 highs is strong. Enough it suggests it has ended correcting the cycle up from the all time lows. This leaves a not so pretty Elliott wave impulse into the July 2018 red wave I highs. The decline from the October 2018 ((B)) highs was five waves. This completed a 3-3-5 Elliott wave expanded flat structure at 9.23 in December 2018. Near term the instrument can see some further weakness while below the September 2019 highs noted with a blue (X). The current pullback can continue toward the 9.83 area before turning higher again.
Thanks for looking. Feel free to come visit our website. Please check out our services free for 14 days and see if we can be of help. Kind regards & good luck trading. Lewis Jones of the ElliottWave-Forecast.com Team
By EWF Lewis
https://elliottwave-forecast.com
ElliottWave-Forecast has built its reputation on accurate technical analysis and a winning attitude. By successfully incorporating the Elliott Wave Theory with Market Correlation, Cycles, Proprietary Pivot System, we provide precise forecasts with up-to-date analysis for 52 instruments including Forex majors & crosses, Commodities and a number of Equity Indices from around the World. Our clients also have immediate access to our proprietary Actionable Trade Setups, Market Overview, 1 Hour, 4 Hour, Daily & Weekly Wave Counts. Weekend Webinar, Live Screen Sharing Sessions, Daily Technical Videos, Elliott Wave Setup .
Copyright © 2019 ElliottWave-Forecast - All Rights Reserved Disclaimer: The above is a matter of opinion provided for general information purposes only and is not intended as investment advice. Information and analysis above are derived from sources and utilising methods believed to be reliable, but we cann
© 2005-2022 http://www.MarketOracle.co.uk - The Market Oracle is a FREE Daily Financial Markets Analysis & Forecasting online publication.