Democrats Launch Formal Trump Impeachment – What Should Gold, Stock Traders Expect?
Stock-Markets / Financial Markets 2019 Sep 26, 2019 - 08:33 AM GMTBy: Chris_Vermeulen
 News of the formal impeachment proceedings came just after the markets closed on September 24, 2019. The markets had already broken a bit lower most of the day after Consumer Confidence and Jobs expectations were weaker than expected. We had just authored a public research post about our belief that the Technology sector was about to breakdown and begin to move lower. Additionally, we pushed out a post about how Silver would become the “Super-Hero” of 2019/2020 based on our expectations of further gains.
We believe the new impeachment proceedings will result in a market that is very similar to what happened when the US invaded Kuwait in August 1990. At that time, the US launched a very fast invasion of Kuwait that prompted a massive news event and resulted in hours of new invasion video that drew millions of Americans into watching the news every night. This invasion was almost like an extended Super Bowl or an extended World Series event where millions of people are actively engaged in this event, stop engaging in the local economy and focus their attentions on the news cycle, content and political circus originating in DC. But first, be sure to opt-in to our free market trend signals newsletter
What Does This Mean for Traders
For traders, it means we have to be prepared for just about anything. It means the news events will become even bigger drivers of market rotation and trends as well as the fact that we must prepare for weaker economic data over the next 13+ months. The impeachment process is going to be a dramatic distraction for many people and business ventures. Many will simply fall into a “protectionist” mode where new expenses, expansion and other facets of life/business will be put on hold until after November 2020 (or later).
Our research team believes the initiation of these impeachment proceedings will act as a process of muting or weakening the US economy over time. Starting out slowly at first, then gaining strength as the news cycle picks up more and more “dirt” while both sides posture and position for advantage into the November 2020 election cycle. The end result will be a decidedly weaker US economy as a result of this new impeachment process and we believe the final outcome could leave some career politicians bloodied and battle-weary.
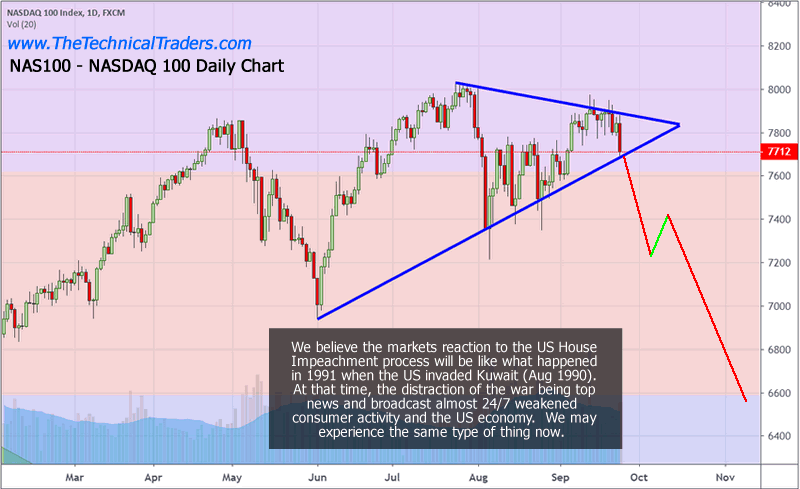
NASDAQ Daily Chart
This NASDAQ Daily chart highlights what we believe will become the future breakdown of the technology heavy NASDAQ as investors become sidetracked on the impeachment investigation and the political side-show that is going on in DC. This type of chaos in DC tends to take the focus away from finance and business as the political theater, the pending US presidential election and the never-ending news cycle fill the void. Weakness and volatility could become a standard operating environment for skilled technical traders over the next 12+ months.

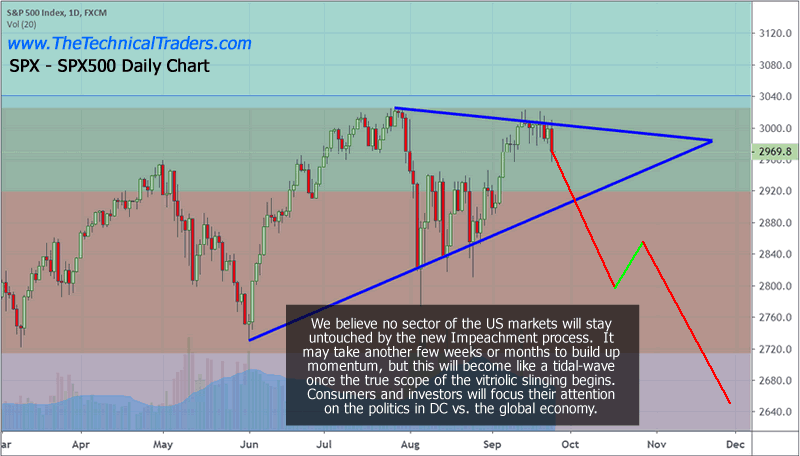
S&P 500 Daily Chart
This S&P 500 Daily chart highlights the same setup and weakness that we expect to settle into the US markets over the next 12+ months. The previous Double-top formation in the SPX near 3026 could become a major point of resistance should price breakdown and continue to move lower on a price revaluation/reversion move. We believe the impeachment investigation announced today will cause enough concern and uncertainty in the global markets to derail any real efforts by the central banks to support the global economy. At this point, consider buying consumer essentials, utilities, precious metals and dividend earning stocks for the longer term.

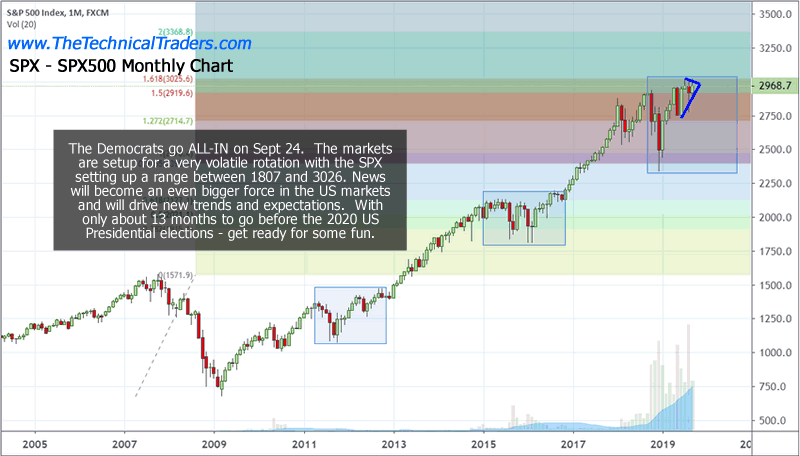
Monthly S&P 500 Chart
This Monthly S&P 500 chart highlights the volatility that has setup in the US markets since early 2018. It also highlights the previous two US presidential election periods on the chart in BLUE. The reality is that every US presidential election cycle is associated with price rotation in the US stock markets. This happens because the level of uncertainty and confusion about forward economic policy is heightened. Traders and investors don’t know what to expect as the political battle wages, so price rotation and volatility is normally heightened as the news cycle drives shorter term price trend. The same thing is going to happen over the next 12+ months – but we have the added FUEL of the impeachment investigation. Get ready for some really big price swings in the global markets.

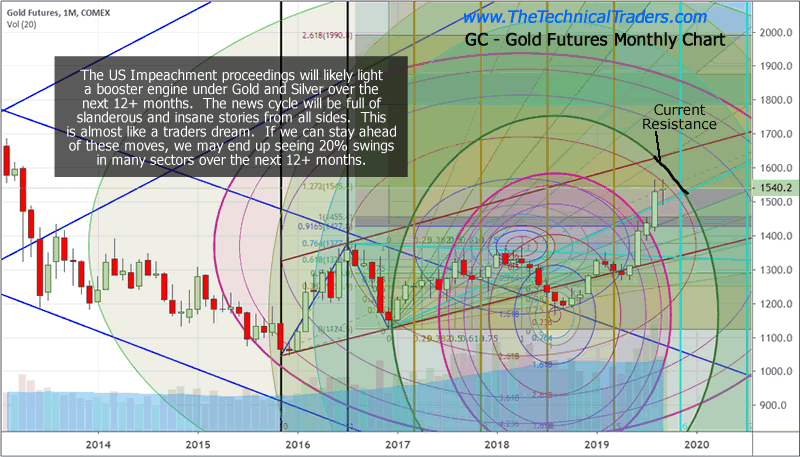
Monthly Gold Chart
Lastly, Gold – that shiny safe metal that almost everyone had forgot about 3+ years ago is now poised for a move to just below $2000 over the next 8+ months. Our initial target is just below $1800 (actually $1795) for Gold on this next upside price move. You can see our proprietary Fibonacci Price Amplitude Arcs on this chart and where we’ve drawn the “Current Resistance” line on this chart. Once gold rallies past this level, $1625, then we believe the next phase of the upside price rally towards $1800 will be very quick – possibly even settling well above $1800.

Many of our readers remember the Kuwait invasion and what happened in the US at that time. Certainly we can’t be the only ones over 50 that remember what happened in 1990. The reality is that society reacts to these types of outside events by either becoming motivated to engage in some way or becomes more protectionist by staying home, watching the news and not taking risks. We believe the later will be the case over the next 12+ months as more clarity is determined by the ongoing impeachment and election processes.
Our advice would be to protect everything you can right now. Don’t wait for a breakdown in prices to learn that you should have protected your assets. The new cycle will be driving prices until things settle after November 2020. Thus, this is like riding out a very violent storm with crazy winds and waves. You don’t know what to expect and where it will hit next. What we do know is there will be some really big waves, price swings and opportunities for skilled technical traders.
With more than 54 years of experience in the markets and have studied almost all types of price theory, technical analysis, and other types of market price, technical, and fundamental analysis techniques. We put our skills to the test every day in order to help our clients find and execute the best trades. If you want to see more of our trading indicators and tools click here.
Chris Vermeulen
www.TheTechnicalTraders.com
Chris Vermeulen has been involved in the markets since 1997 and is the founder of Technical Traders Ltd. He is an internationally recognized technical analyst, trader, and is the author of the book: 7 Steps to Win With Logic
Through years of research, trading and helping individual traders around the world. He learned that many traders have great trading ideas, but they lack one thing, they struggle to execute trades in a systematic way for consistent results. Chris helps educate traders with a three-hour video course that can change your trading results for the better.
His mission is to help his clients boost their trading performance while reducing market exposure and portfolio volatility.
He is a regular speaker on HoweStreet.com, and the FinancialSurvivorNetwork radio shows. Chris was also featured on the cover of AmalgaTrader Magazine, and contributes articles to several leading financial hubs like MarketOracle.co.uk
Disclaimer: Nothing in this report should be construed as a solicitation to buy or sell any securities mentioned. Technical Traders Ltd., its owners and the author of this report are not registered broker-dealers or financial advisors. Before investing in any securities, you should consult with your financial advisor and a registered broker-dealer. Never make an investment based solely on what you read in an online or printed report, including this report, especially if the investment involves a small, thinly-traded company that isn’t well known. Technical Traders Ltd. and the author of this report has been paid by Cardiff Energy Corp. In addition, the author owns shares of Cardiff Energy Corp. and would also benefit from volume and price appreciation of its stock. The information provided here within should not be construed as a financial analysis but rather as an advertisement. The author’s views and opinions regarding the companies featured in reports are his own views and are based on information that he has researched independently and has received, which the author assumes to be reliable. Technical Traders Ltd. and the author of this report do not guarantee the accuracy, completeness, or usefulness of any content of this report, nor its fitness for any particular purpose. Lastly, the author does not guarantee that any of the companies mentioned in the reports will perform as expected, and any comparisons made to other companies may not be valid or come into effect.
Chris Vermeulen Archive |
© 2005-2022 http://www.MarketOracle.co.uk - The Market Oracle is a FREE Daily Financial Markets Analysis & Forecasting online publication.


