


Market Chart Patterns to Spot High-Confidence Trading Opportunities in a "Pinch"!
InvestorEducation / Learn to Trade Sep 08, 2019 - 02:11 PM GMTBy: EWI

 Why this single moving average chart pattern belongs in your technical toolbox today
When it comes to the world of technical market analysis, the biggest obstacle isn't a lack of quality, but rather, an abundance of choice. There are literally hundreds of technical tools out there, with digital libraries and chat boards devoted to the many variations of individual components.
If you used them all, your technical pages would look like the motherboard of the Starship Enterprise. And you'd need Spock himself to interpret the massive influx of data.
So, where on planet Earth do you start? How do you curate the right technical tools to support your trading style and maximize your ability to spot high-confidence setups in real-world markets?
Well, that's where our Trader's Classroom editor Jeffrey Kennedy comes in. In his August 9 video lesson titled "Pinch Me! How to Build Your Ideal, Custom Technical Indicator Page," Jeffrey shares one of his top three favorite technical chart patterns: the moving average "pinch.”
Right away, Jeffrey stresses the two main functions of any technical indicator page:
- Identify the trend
- Identify areas of oversold and overbought conditions
The moving average (MA) "pinch" accomplishes both, and here's how: First, the pinch occurs when all three MA lines -- green, red and grey -- come together and appear to form one single line. Then ... well, you'll just have to watch this free video to find out.
Jeffrey shows you several real-world examples of MA pinches, including this one in late 2018 price action of Big Board listee Chipotle Mexican Grill (ticker symbol CMG).
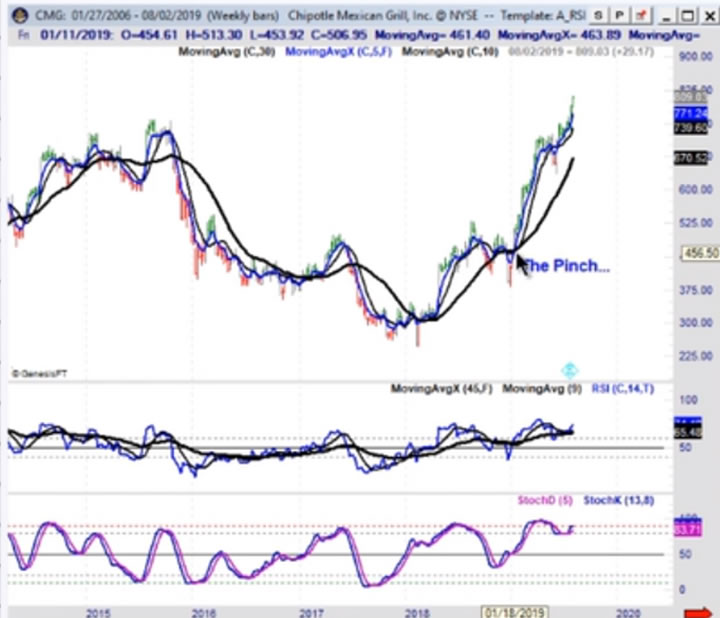
In the free video, Jeffrey highlights the area of compression where the pinch occurred and describes it as a "beautiful little bullish set-up," confirmed by the powerful advance that followed.
In fact, during the time of the pinch's formation in Chipotle, Jeffrey featured the market in his January 10, 2019 Trader's Classroom. There, Jeffrey homed in on the narrow and choppy price action in CMG, a six-month long sideways move that barely retraced 50% of the preceding rally, magnified here:
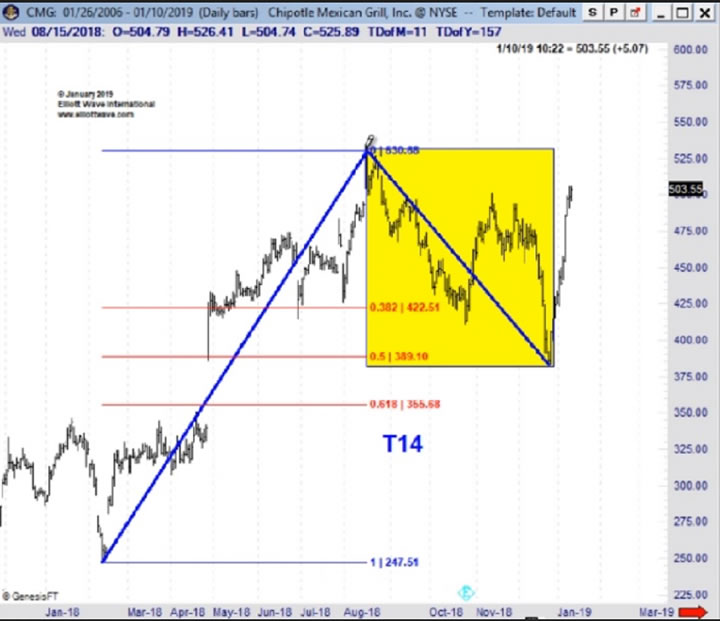
The same period of compression identified as a MA "pinch" was confirmed by all the characteristics of counter-trend price action -- the latter of which led Jeffrey to include Chipotle in his "I Like It!" market list for a strong move higher.
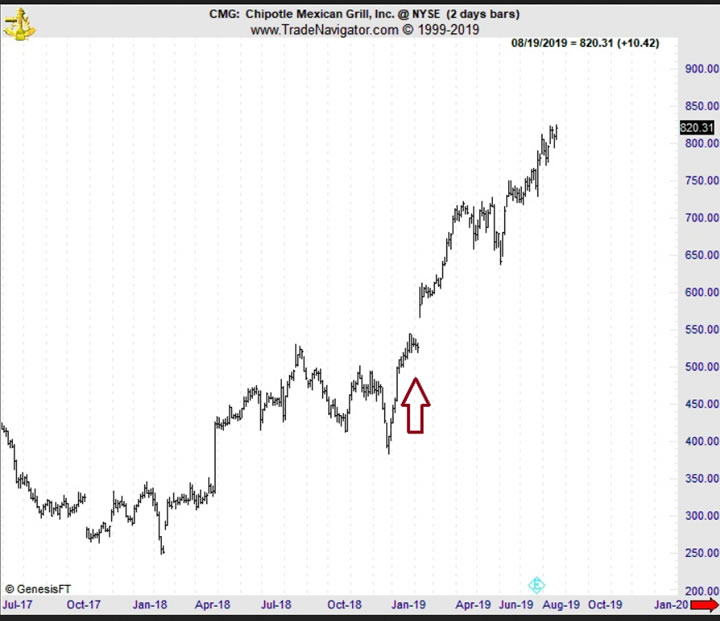
The next chart captures the volatile upside explosion that has seen a doubling in value of CMG prices to new record highs:
The first step to identifying a moving average "pinch" is to understand the mechanisms of the moving average indicator. In his August 9 Trader's Classroom video "Pinch Me!" Jeffrey lays the groundwork with a user-friendly lesson covering all the need-to-know basics.
Jeffrey also shows you how an MA pinch preceded three major buying opportunities in 2013, 2016 and 2019 in the tech-giant Apple.
Plus, you'll see how an MA pinch underway right now in the Healthcare Select Sector SPDR fund (XLV) suggests an "exciting" period of volatility may be ahead.
Free, watch Jeffrey Kennedy's Trader's Classroom “Pinch me!” video lesson now -- and see why the MA pinch is the first step to building a custom technical indicator page.
No, this isn't a dream; the power of the pinch is very real!
EWI is the world's largest independent technical analysis firm. Founded by Robert Prechter in 1979, EWI helps investors and traders to catch market opportunities and avoid potential pitfalls before others even see them coming. Their unique perspective and high-quality analysis have been their calling card for nearly 40 years, featured in financial news outlets such as Fox Business, CNBC, Reuters, MarketWatch and Bloomberg.
© 2005-2022 http://www.MarketOracle.co.uk - The Market Oracle is a FREE Daily Financial Markets Analysis & Forecasting online publication.