


FXA Bearish Cycle From The July 2011 Highs
Companies / Exchange Traded Funds Aug 27, 2019 - 02:21 PM GMT

 Firstly the FXA ETF fund is the Australian dollar tracking fund that has an Inception Date of 06/21/2006. With that said the fund mainly reflects the currency spot price of the AUDUSD forex pair. The data available from the Reserve Bank of Australia at their website suggests the spot price was 1.4875 back in 1973 to 1974 that would translate into an FXA price of around 148.75. It should be obvious that is a long term downtrend. I believe the bearish cycle analysis suggests it can go lower to possibly retest those lows eventually.
Back before the FXA fund inception date, the AUDUSD spot currency price reached what is still the currency low in April 2001 at .4778. From there the currency pair went up in three swings until July 2011 at a high of 1.1080. That translated into the FXA ETF fund price high of 110.99 in July 2011. This is where the monthly Elliott wave analysis begins on the chart below.
The analysis continues below the monthly chart.
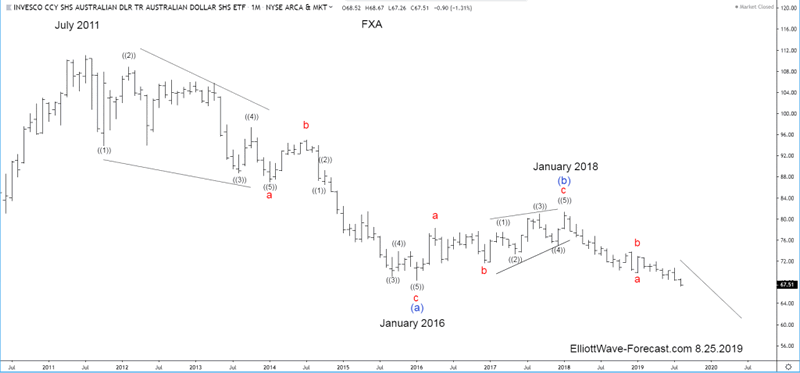
Secondly the decline from the aforementioned July 2011 highs at least in this FXA ETF fund does not seem legitimately able to count the whole cycle from there down to the January 2016 lows as a regular impulse by itself as a whole. The cycle lower in the blue wave (a) has been subdivided as an a-b-c in red. The instrument has since then bounced in three swings in what appeared to be a zig zag Elliott wave (b) that ended in January 2018.
The analysis continues below the weekly chart.
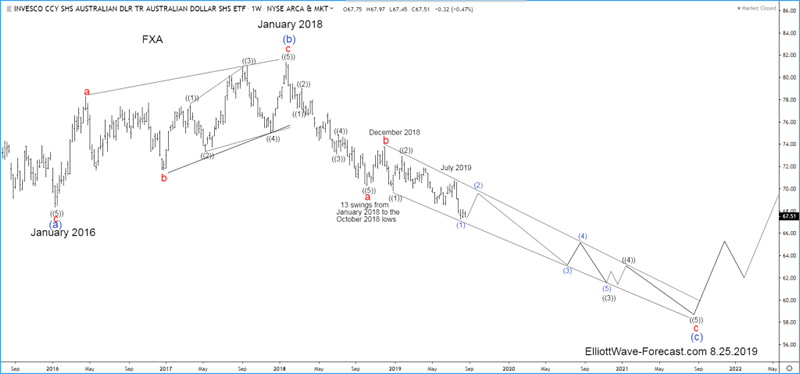
Thirdly in conclusion since the wave (b) highs from January 2018 the instrument has declined in a relatively clean & clear 5 wave impulse in wave a to the October 2018 lows. A bounce to the December 2018 highs was technically strong. It suggested it was correcting the cycle from the January 2018 highs. The instrument has since made new lows under the January 2016 lows. That now gives it a bearish sequence again to go along with the obvious down trend.
The equal legs of the larger blue (a) -(b) on the two charts shown above comes in at the 38.70 area. I only drew a proposed decline toward the 61.8 extension area of the (a)-(b) which is at 55.00. I think this area can be seen realistically later in the coming years. The decline should continue lower most immediately while below the July 2019 highs, more importantly while below the December 2018 highs.
Thanks for looking. Feel free to come visit our website. Please check out our services Free for 14 days and see if we can be of help. Kind regards & good luck trading. Lewis Jones of the ElliottWave-Forecast.com Team
By EWFHendra
https://elliottwave-forecast.com
ElliottWave-Forecast has built its reputation on accurate technical analysis and a winning attitude. By successfully incorporating the Elliott Wave Theory with Market Correlation, Cycles, Proprietary Pivot System, we provide precise forecasts with up-to-date analysis for 52 instruments including Forex majors & crosses, Commodities and a number of Equity Indices from around the World. Our clients also have immediate access to our proprietary Actionable Trade Setups, Market Overview, 1 Hour, 4 Hour, Daily & Weekly Wave Counts. Weekend Webinar, Live Screen Sharing Sessions, Daily Technical Videos, Elliott Wave Setup .
Copyright © 2019 ElliottWave-Forecast - All Rights Reserved Disclaimer: The above is a matter of opinion provided for general information purposes only and is not intended as investment advice. Information and analysis above are derived from sources and utilising methods believed to be reliable, but we cann
© 2005-2022 http://www.MarketOracle.co.uk - The Market Oracle is a FREE Daily Financial Markets Analysis & Forecasting online publication.