The Nuts and Bolts: Yield Inversion Says Recession is Coming But it May take 24 months
Economics / Recession Aug 18, 2019 - 06:14 PM GMTBy: QUANTO
 Consumers continue to power economic growth, as retail sales rose 0.7% in July, after a 0.3% increase in June, the Commerce Department reported Thursday. Excluding autos, sales soared 1.0%, after a 0.7% climb in June. Economists polled by IFR Markets expected a 0.3% rise in the headline number and 0.4% excluding autos. Auto sales were down 0.6% in July, after 0.3% growth the prior month.
Preliminary second quarter productivity figures also were positive news for the economy, as non-farm productivity grew a healthy 2.3% on an annualized basis in the second quarter, albeit down from the first quarter’s 3.5% growth, the Labor Department reported. Unit labor costs grew 2.4% in the period, after a revised 5.5% jump in the first quarter, previously reported as a 1.6% decline.
Economists projected a 1.5% gain in productivity and a 1.8% rise in labor costs.
Initial jobless claims rose to 220,000 in the week ended Aug. 10 from 211,000 the prior week, while continuing claims rose to 1.726 million from 1.687 million.
Economists expected 212,000 claims in the week.
The Empire State Manufacturing Survey suggested modest growth, as the general business conditions index crept to 4.8 in August from 4.3 in July. The new orders and shipments indexes also gained. The six-months ahead general business conditions index dropped to 25.7 from 30.8, the Federal Reserve Bank of New York reported. Business inventories were unchanged in June after a 0.3% rise in May, while sales grew 0.1% after a 0.1% decrease in May, the Commerce Department reported. Builders’ confidence in the market for new single-family homes grew as the National Association of Home Builders' housing market index rose to 66 in August from 65 in July. Economists expected a 65 reading.
The yield on two-year U.S. Treasury notes was higher than the yield on the 10-year for a while Wednesday, marking the first time since June 2007 this curve has inverted. Many market participants see this as a sign of a coming recession in the next year or two. Other parts of the curve — the 3-month to 10-year and the 2- to 5-year — inverted earlier this year and remain inverted.
Yield curve inversion is a “long-leading indicator,” said Payden & Rygel Chief Economist Jeffrey Cleveland. “Long because a long period can elapse between inversion and a recession. For example, 2s10s inverted in December 2005 and the recession did not begin until December 2007 — a full 24 months.” The current inversion was, in part, due to two-years rising “(on the hot CPI data) more than 10-year yields (driven more by global concerns, e.g., the low/negative yields in Europe).”
Let us look at some trading charts and some more details regarding the economy.
USDJPY 4HR
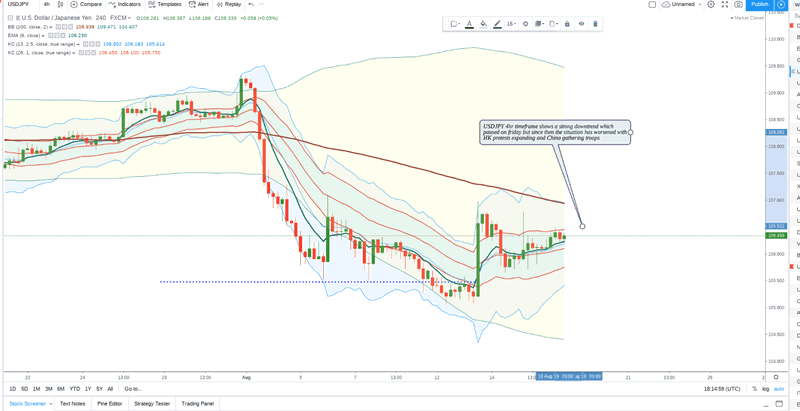
USDJPY 4hr timeframe shows a strong downtrend which paused on friday but since then the situation has worsened with HK protests expanding and China gathering troops
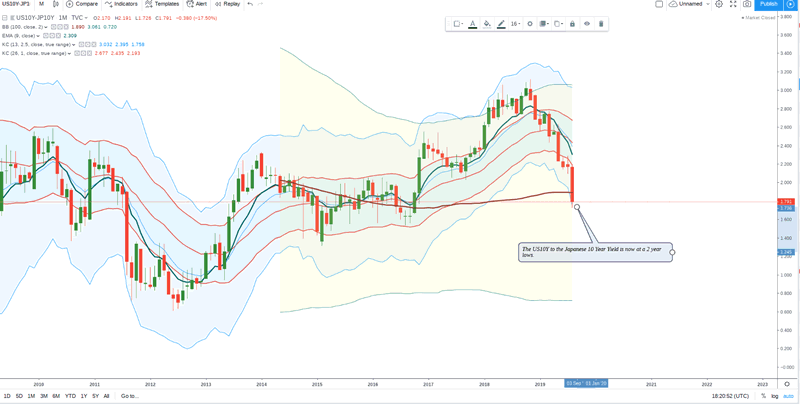
The US10Y to the Japanese 10 Year Yield is now at a 2 year lows. On the Japanese debt situation:
Japan's net debt as a share of GDP.
- 1990: 19%
- 2020: 153%
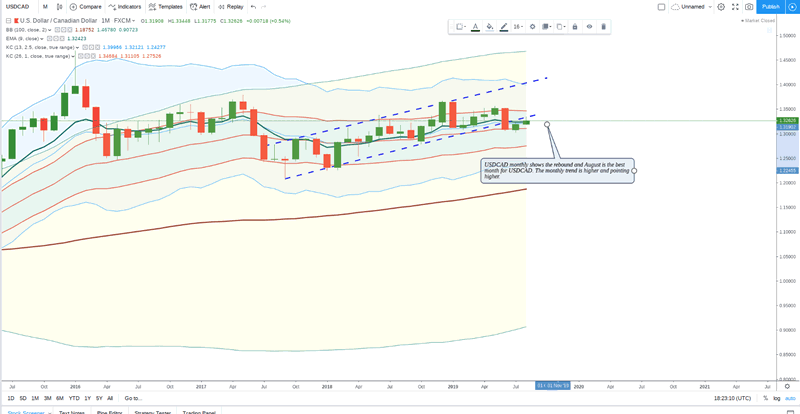
USDCAD monthly shows the rebound and August is the best month for USDCAD. The monthly trend is higher and pointing higher.
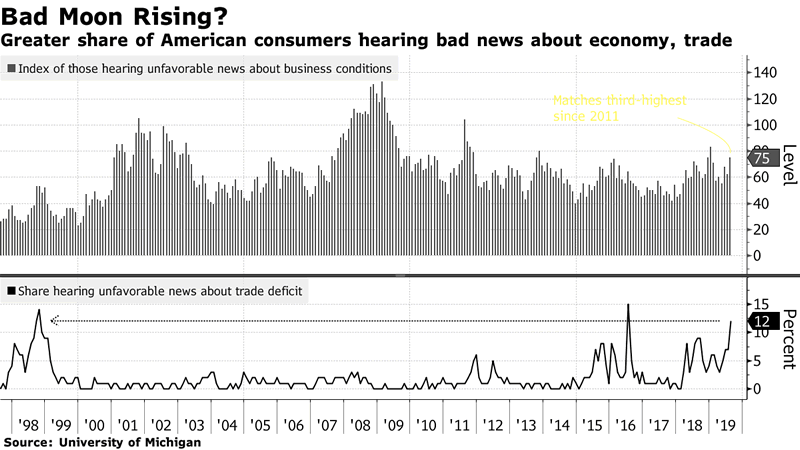
The index of those hearing bad news regarding the economy is now rising and is at 2 year highs at 12%. This often translates into underperformance on consumer metrics in future retail reading.
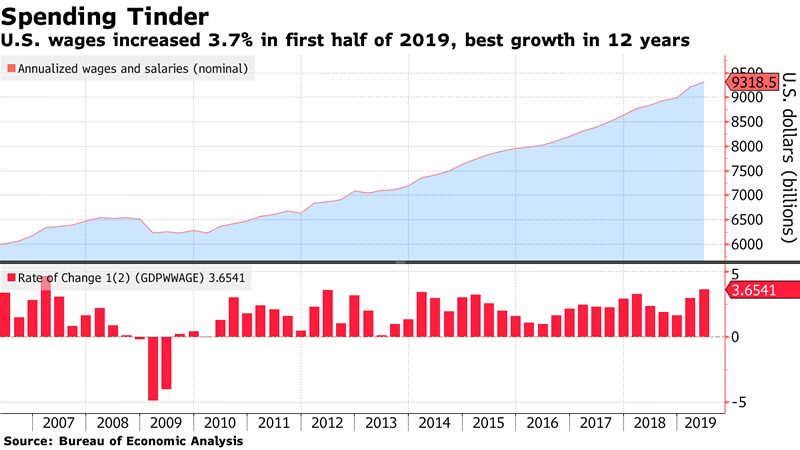
The good spot in that is that the wages are still growing very healthy and hence there is a hope that consumer spending may not be affected despite the swirl of bad news about the world economy.
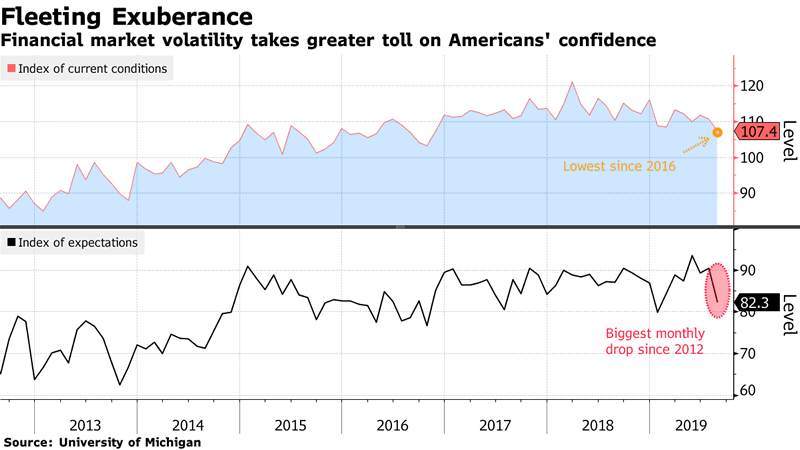
The University of Michigan index of expectation show a drop in level to 82.3 which is a new 2019 lows. The index of current conditions is the lowest since 2016. The consumer which has been a strong point of US economy is starting to wither away.
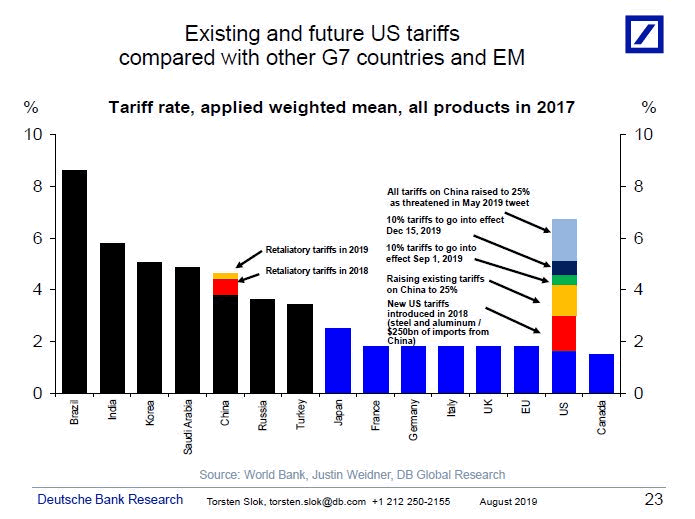
The above is a good depiction of what different countries charge as Tariff. Brazil has the highest Tariff but US is now second highest among all the countries above. This has acted as a major source of disruption world supply chain, the full effects of which we will continue to reap in the coming years.
China industrial production is precarious as the yoy growth has dipped to 2009 lows. Tariff have halted production at may factories.
World Bank stock prices relative to general equities have now fallen to all time lows. This is suggestive of a major banking crisis world wide and we could see further and further job cuts across the world. The banking industry will see a major asset repricing.
This the spread of XLU to treasuries.It is dipping signifying the significant crunch in liquidity.
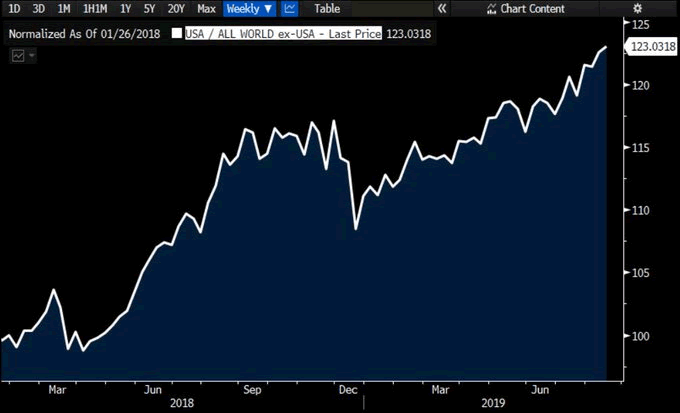
Here is a chart of SPX vs rest of world equities. The US equities are still outperforming other countries equity markets since last one year. The trade war is continuing to benefit US equities
We will be releasing a lot of trading charts for all members so please register. Open a account here: Free Register.
QUANTO Trade copier
We run a successful trading system which is doing well into August.
Current august returns stand at +22% while overall returns +109%
If you would like this performance on your trading account Contact Us
Source: https://quanto.live/dailysetups/the-nuts-and-bolts-its-the-details-that-matter/
By Quanto
Quanto.live is a Investment Management firm with active Trading for clients including Forex, Crypto. We send our trades via trade copiers which are copied to clients trading terminals. Top notch fundamental analysis and trading analysis help our clients to generate superior returns. Reach out to us: http://quanto.live/reach-us/
© 2019 Copyright Quanto - All Rights Reserved Disclaimer: The above is a matter of opinion provided for general information purposes only and is not intended as investment advice. Information and analysis above are derived from sources and utilising methods believed to be reliable, but we cannot accept responsibility for any losses you may incur as a result of this analysis. Individuals should consult with their personal financial advisors.
© 2005-2022 http://www.MarketOracle.co.uk - The Market Oracle is a FREE Daily Financial Markets Analysis & Forecasting online publication.


