


Natural Gas Sets Up Two New Trades – Here They Are
Commodities / Natural Gas Jul 27, 2019 - 12:27 PM GMTBy: Chris_Vermeulen

 Before we discuss these incredible trade setups in the Energy sector, we have to discuss the continued shifting global economy and how that relates to these setups. Nearly three weeks ago, we posted a research article suggesting Crude Oil would call to levels near $50 over the next 30+ days, then stall for about 45 days before falling further and potentially attempting new lows near $40 ppb. It is important to understand certain aspects of the global economy, economic demand and how it relates to seasonal patterns for Energy.
We believe the move lower is Crude Oil is related to a supply glut that continues to plague the global markets while global economic trade, shipping, and activity continue to weaken. Too much oil supply with weakening global economic activity means Crude Oil will likely waffle lower until this dynamic changes.
Please read our recent research post to know where Crude Oil is likely to head next. Also this crude oil, prediction uses our oil price DNA algorithm to show us the future price range of oil.
Other energy-related symbols, like Natural Gas and ERY, are set up for a different type of price move.
The reality of the situation is that once Crude Oil reaches to levels near $50 ppb, it is very likely that a support level will push Crude back higher (as we suggest in our research) which will align with a seasonal pattern for Natural Gas and early Winter demand for heating oil. September, October, and November are typically a ramp-up period for winter demand and end of year holiday travel. People tend to take advantage of the last bit of Summer to seek out vacation spots, prepare for winter and push the cold back as long as possible.
Future contracts may move higher, in preparation of this seasonal trend, many months before the season actually starts. This is the reason we believe the energy sector is setting up some incredible opportunities for skilled technical traders.
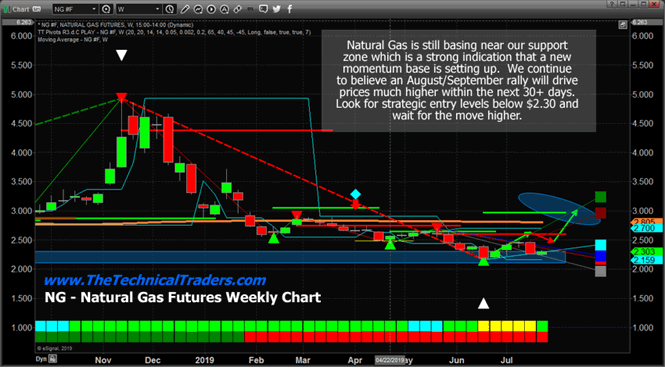
The weekly chart of Natural Gas
This first Weekly chart of Natural Gas highlights a basing pattern that we’ve been following for months. We believe any move below $2.30 is a strong bottoming/basing setup for skilled traders and our predictive modeling systems suggest we are just weeks (3 to 5+) away from a big upside move in NG.
We believe natural gas will continue to fall and base. Once a bottom has been made the upside potential for NG over the next 60+ days is quite substantial. We believe an in initial upside move after it bottoms will be to levels above $3.15 will take place before October 10 and that potential for an extreme breakout upside move above $4.00 is quite likely before the end of November 2019.
Please read this article to learn more about our research into NG and the opportunities that are setting up now. Also, this post we shared Natural Gas Moves Into Basing Zone.
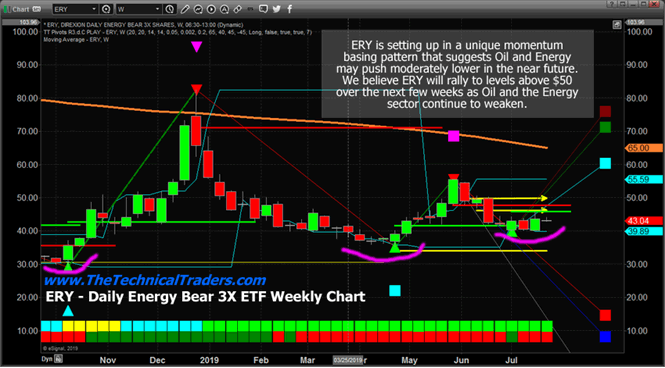
ERY – Bear Energy Sector Chart
Keeping in mind that the setup within the energy sector is two-fold. First, Oil and NG will continue to fall and base/bottom (moving slightly lower over the next few weeks). This is why ERY is such a great setup right now. Any breakdown in energy commodity prices over the next 3~5 weeks will push ERY 15% to 25% higher from current levels – which is exactly what we are expecting to happen.
Then, as Crude Oil and Natural Gas base in their support zones, ERY will peak which is when we want to pull profits from ERY and watch other bullish energy ETFs for long side setups.
From current levels, we believe ERY will target $50 to $52.50 fairly quickly as Crude Oil and NG continue to move lower and setup a momentum base within the basing zone/support range. Remember Crude Oil should move to levels near $50 (a full 10% lower than current price levels) before basing.
Concluding Thoughts:
As we’ve been suggesting for months, 2019 and 2020 are setting up to be incredible years for skilled technical traders. These moves in commodities, energy, and metals are providing us with trade after trade of 10%, 20% or more. Almost every month, the markets are setting up 10 to 15+ incredible trading opportunities and all we have to do is time our entries and run these trades as we do any other trade. Not all trade setups are the kind we like and we only enter the ones that we think have the highest opportunity and lowest risk.
Get ready because these incredible setups in Metals and Energy should keep you busy pulling the trigger to create profits over the next 5+ months or longer with my Wealth Building & Global Financial Reset Newsletter.
Join me with a 1 or 2-year subscription to lock in the lowest rate possible and ride my coattails as I navigate these financial market and build wealth while others lose nearly everything they own during the next financial crisis.
Join Now and Get a 1oz Silver Round or Gold Bar Shipped To You Free. Follow our research and visit www.TheTechnicalTraders.com to learn how we can help you find and execute better trades.
Chris Vermeulen
www.TheTechnicalTraders.com
Chris Vermeulen has been involved in the markets since 1997 and is the founder of Technical Traders Ltd. He is an internationally recognized technical analyst, trader, and is the author of the book: 7 Steps to Win With Logic
Through years of research, trading and helping individual traders around the world. He learned that many traders have great trading ideas, but they lack one thing, they struggle to execute trades in a systematic way for consistent results. Chris helps educate traders with a three-hour video course that can change your trading results for the better.
His mission is to help his clients boost their trading performance while reducing market exposure and portfolio volatility.
He is a regular speaker on HoweStreet.com, and the FinancialSurvivorNetwork radio shows. Chris was also featured on the cover of AmalgaTrader Magazine, and contributes articles to several leading financial hubs like MarketOracle.co.uk
Disclaimer: Nothing in this report should be construed as a solicitation to buy or sell any securities mentioned. Technical Traders Ltd., its owners and the author of this report are not registered broker-dealers or financial advisors. Before investing in any securities, you should consult with your financial advisor and a registered broker-dealer. Never make an investment based solely on what you read in an online or printed report, including this report, especially if the investment involves a small, thinly-traded company that isn’t well known. Technical Traders Ltd. and the author of this report has been paid by Cardiff Energy Corp. In addition, the author owns shares of Cardiff Energy Corp. and would also benefit from volume and price appreciation of its stock. The information provided here within should not be construed as a financial analysis but rather as an advertisement. The author’s views and opinions regarding the companies featured in reports are his own views and are based on information that he has researched independently and has received, which the author assumes to be reliable. Technical Traders Ltd. and the author of this report do not guarantee the accuracy, completeness, or usefulness of any content of this report, nor its fitness for any particular purpose. Lastly, the author does not guarantee that any of the companies mentioned in the reports will perform as expected, and any comparisons made to other companies may not be valid or come into effect.
Chris Vermeulen Archive |
© 2005-2022 http://www.MarketOracle.co.uk - The Market Oracle is a FREE Daily Financial Markets Analysis & Forecasting online publication.