


Weekly Stock Market Technical Analysis Report - 31st March 2007
Stock-Markets / US Stock Markets Mar 31, 2007 - 02:00 PM GMTBy: Mike_Burk

The good news is: Next week as well as the entire month of April have had a very positive seasonal bias.
Short Term : Last week new lows on the NASDAQ peaked at 56 on Thursday well below the 159 seen on March 5. The high for the NYSE was 32 on Wednesday also well below the 106 reported on March 5.
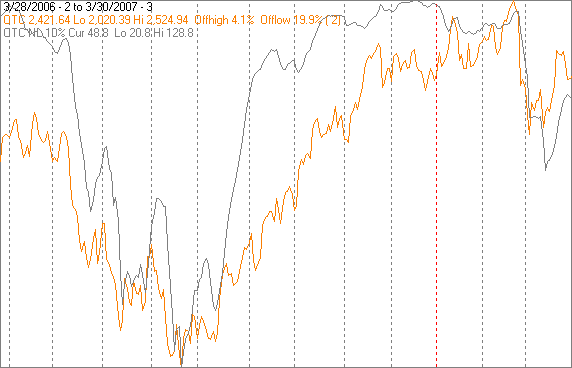
The chart below covers the past year showing the OTC in orange and a 10% trend (19 day EMA) of NASDAQ new lows (OTC NL) in black. OTC NL has been plotted on an inverted Y axis so increasing new lows move the indicator downward (up is good).
The upward movement of OTC NL was arrested on Thursday casting some suspicion on rally off the March lows.
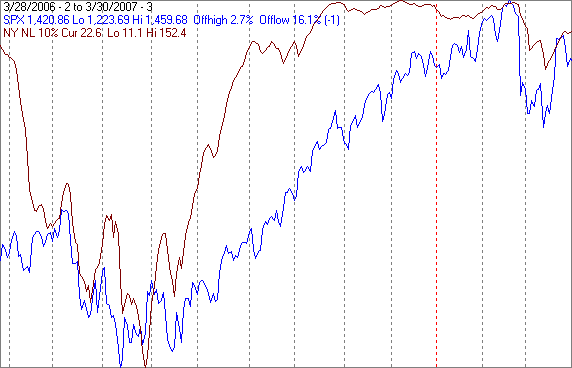
The next chart is similar to the previous one except it shows the S&P 500 (SPX) in blue and the indicator NY NL has been calculated from NYSE new lows. The picture is similar to the NASDAQ.
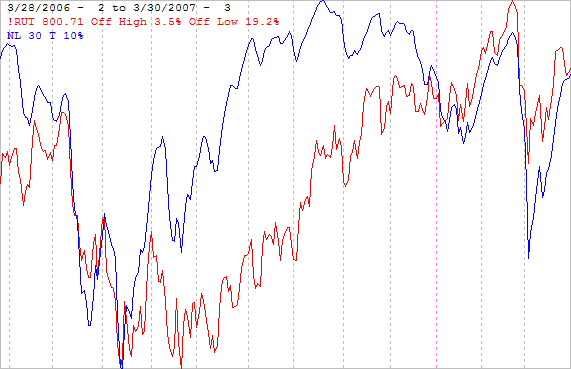
In the following charts are similar to those above except new lows have been calculated from the component issues of the indices over the trailing 6 weeks rather than 52 weeks as reported by the exchanges.
The following chart shows the Russell 2000 (R2K) in red and a new low indicator calculated from the component issues of the R2K.
NL continued to move upward last week while the index was declining.
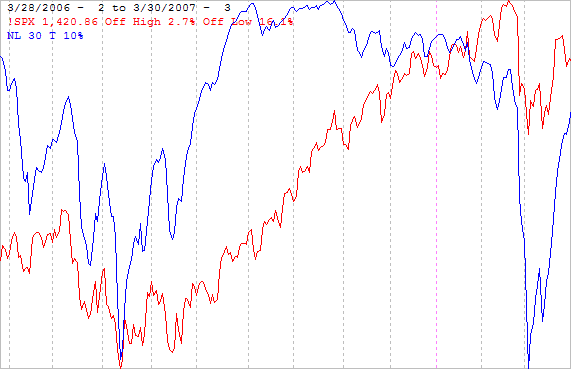
The next chart is similar to the one above except is shows the SPX and NL has been calculated from the component issues of the SPX.
NL hit its low point for the past year in early March and continued to recover last week while the index declined.
The decline last week was not surprising considering how overbought the market was from the week before. The new low indicators held up well during the market's decline last week.
Intermediate term
Advance - decline lines (ADL) are a running total of declining issues subtracted from advancing issues. Historically they have had a negative bias making them valuable as top indicators. That is, usually the AD line will hit a cycle high a little before the major indices hit their cycle highs and fail to confirm the final high in the index.
To make this work you must begin your evaluation of the AD line with a cycle low and ignore everything that happened earlier.
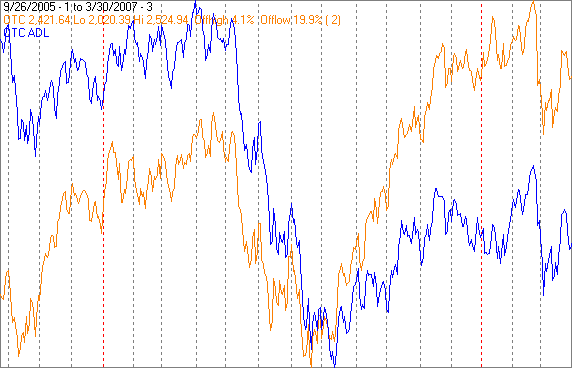
The chart below covers the past year and a half showing the OTC in orange and an AD line calculated from NASDAQ advancing - declining issues (OTC NL) in blue. Dashed vertical lines have been drawn on the 1st trading day of each month the vertical line is red on the 1st trading day of the year.
OTC ADL hit a high on about April 1, 2006 and the index hit a cycle high about 2 weeks later unconfirmed by OTC ADL. Restarting the OTC ADL calculations after the summer lows OTC ADL confirmed the index high in late February 2007 suggesting that was not the cycle high.
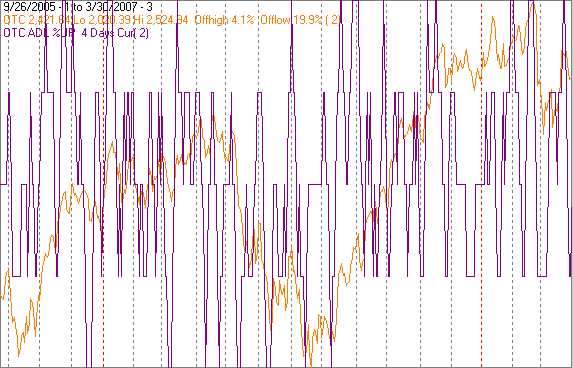
The next chart covers the same period.
The indicator shows the percentage of the preceding 4 trading days that the OTC ADL has been up. When the OTC ADL has been up for 4 consecutive days the indicator touches the top of the chart and if it has been down for 4 consecutive days it touches the bottom of the chart.
This indicator usually gives some warning of an impending top by touching the bottom of the chart ahead of a high in the index.
It has not touched the bottom of the screen since the lows of last summer.
Seasonality
Next week is the week prior to Good Friday and includes the first 4 trading days of April.
There are two sets of tables, the first showing the first 4 trading days of April with OTC data from 1963 - 2003 during the 3rd year of the Presidential Cycle and SPX data beginning with 1928. The second set of tables shows the 4 trading days prior to Good Friday. SPX data prior to 1953 has been omitted on the Good Friday tables because the market traded 6 days a week.
There are summaries for both the 3rd year of the Presidential Cycle and all years combined.
The first 4 trading days of April during the 3rd year of the Presidential cycle have had a very strong positive bias. Since 1931 the SPX has been up nearly 80% of the time while the OTC has been up over 70% of the time. The average return for both indices has been over 1%. Over all years combined the SPX has been positive 68% of the time with an average return of 0.53% while the OTC has been up less than 50% of the time with an average negative return.
During the week prior to Good Friday both indices have been up about 2/3 of the time with positive average returns.
Report for the first 4 days of April.
The number following the year represents its position in the presidential cycle.
The number following the daily return represents the day of the week;
1 = Monday, 2 = Tuesday etc.
| OTC Presidential Year 3 | |||||
| Day1 | Day2 | Day3 | Day4 | Totals | |
| 1963-3 | 0.13% 1 | 0.34% 2 | 0.28% 3 | 0.75% 4 | 1.50% |
| 1967-3 | 0.36% 1 | -0.52% 2 | 0.06% 3 | 0.48% 4 | 0.38% |
| 1971-3 | 0.35% 4 | 0.49% 5 | 0.29% 1 | 0.36% 2 | 1.49% |
| 1975-3 | -0.32% 2 | 0.27% 3 | -0.89% 4 | -0.29% 5 | -1.23% |
| 1979-3 | -0.30% 1 | 0.74% 2 | 0.32% 3 | 0.47% 4 | 1.22% |
| 1983-3 | -0.76% 1 | 0.04% 2 | -0.88% 3 | 0.10% 4 | -1.50% |
| Avg | -0.13% | 0.20% | -0.22% | 0.22% | 0.07% |
| 1987-3 | -0.40% 3 | 0.87% 4 | 1.22% 5 | 0.10% 1 | 1.79% |
| 1991-3 | -0.30% 1 | 2.15% 2 | 0.78% 3 | 0.51% 4 | 3.14% |
| 1995-3 | 0.10% 1 | -0.53% 2 | 0.32% 3 | -0.31% 4 | -0.42% |
| 1999-3 | 1.30% 4 | 2.68% 1 | 0.12% 2 | -0.73% 3 | 3.36% |
| 2003-3 | 0.53% 2 | 3.59% 3 | -0.01% 4 | -0.94% 5 | 3.18% |
| Avg | 0.25% | 1.75% | 0.49% | -0.27% | 2.21% |
| OTC sumamry for Presidential Year 3 1963 - 2003 | |||||
| Averages | 0.06% | 0.92% | 0.15% | 0.04% | 1.17% |
| % Winners | 55% | 82% | 73% | 64% | 73% |
| MDD 4/6/1983 1.60% -- 4/4/1975 1.23% -- 4/4/2003 .95% | |||||
| OTC summary for all years 1963 - 2006 | |||||
| Averages | -0.32% | -1.02% | -0.16% | 0.72% | -0.78% |
| % Winners | 55% | 36% | 55% | 36% | 45% |
| MDD 4/4/2001 10.95% -- 4/5/1973 4.63% -- 4/6/1993 3.77% | |||||
| SPX Presidential Year 3 | |||||
| Day1 | Day2 | Day3 | Day4 | Totals | |
| 1931-3 | -1.02% 3 | -0.42% 4 | 1.34% 6 | -1.02% 1 | -1.12% |
| 1935-3 | 0.83% 1 | -0.47% 2 | -0.24% 3 | 1.06% 4 | 1.18% |
| 1939-3 | 2.28% 6 | 0.27% 1 | -2.13% 2 | 0.36% 3 | 0.78% |
| 1943-3 | 0.09% 4 | -0.26% 5 | 0.17% 6 | 0.09% 1 | 0.09% |
| 1947-3 | 0.40% 2 | -0.07% 3 | -0.26% 4 | -0.07% 6 | 0.00% |
| 1951-3 | -0.37% 1 | -0.28% 2 | 0.66% 3 | 1.36% 4 | 1.36% |
| 1955-3 | 1.01% 5 | -0.32% 1 | 0.68% 2 | 0.24% 3 | 1.61% |
| 1959-3 | 0.45% 3 | 0.56% 4 | 0.79% 5 | 0.28% 1 | 2.08% |
| 1963-3 | 0.42% 1 | -0.01% 2 | 0.78% 3 | 0.73% 4 | 1.91% |
| Avg | 0.38% | -0.03% | 0.53% | 0.51% | 1.39% |
| 1967-3 | -1.06% 1 | -0.02% 2 | 0.64% 3 | 0.17% 4 | -0.28% |
| 1971-3 | 0.08% 4 | 0.17% 5 | 0.23% 1 | 0.71% 2 | 1.19% |
| 1975-3 | -0.86% 2 | -0.25% 3 | -1.12% 4 | -0.77% 5 | -3.01% |
| 1979-3 | -0.68% 1 | 1.49% 2 | 0.24% 3 | 0.59% 4 | 1.65% |
| 1983-3 | 0.04% 1 | -0.74% 2 | -0.56% 3 | 0.48% 4 | -0.78% |
| Avg | -0.50% | 0.13% | -0.11% | 0.24% | -0.25% |
| 1987-3 | 0.24% 3 | 0.42% 4 | 2.31% 5 | 0.51% 1 | 3.48% |
| 1991-3 | -1.04% 1 | 2.21% 2 | -0.15% 3 | 0.22% 4 | 1.24% |
| 1995-3 | 0.23% 1 | 0.68% 2 | 0.07% 3 | 0.10% 4 | 1.07% |
| 1999-3 | 0.57% 4 | 2.12% 1 | -0.24% 2 | 0.68% 3 | 3.13% |
| 2003-3 | 1.21% 2 | 2.61% 3 | -0.51% 4 | 0.27% 5 | 3.59% |
| Avg | 0.24% | 1.61% | 0.30% | 0.36% | 2.50% |
| SPX summary for Presidential Year 3 1931 - 2003 | |||||
| Averages | 0.15% | 0.40% | 0.14% | 0.32% | 1.01% |
| % Winners | 68% | 47% | 58% | 84% | 79% |
| MDD 4/4/1975 2.98% -- 4/4/1939 2.13% -- 4/2/1931 1.44% | |||||
| SPX summary for all years 1928 - 2006 | |||||
| Averages | 0.09% | 0.16% | 0.11% | 0.18% | 0.53% |
| % Winners | 61% | 57% | 55% | 62% | 68% |
| MDD 4/5/1932 7.93% -- 4/4/2001 4.92% -- 4/4/1986 4.27% | |||||
Report for the 4 days before Good Friday.
| OTC Presidential Year 3 | |||||
| Day4 | Day3 | Day2 | Day1 | Totals | |
| 1963-3 | 0.25% 1 | 0.18% 2 | -0.18% 3 | -0.28% 4 | -0.03% |
| 1967-3 | 0.15% 1 | 0.16% 2 | -0.65% 3 | 0.36% 4 | 0.02% |
| 1971-3 | 0.29% 1 | 0.36% 2 | 0.46% 3 | 0.30% 4 | 1.41% |
| 1975-3 | -1.98% 1 | -0.12% 2 | 1.65% 3 | 0.82% 4 | 0.38% |
| 1979-3 | -0.01% 1 | 0.36% 2 | -0.48% 3 | -0.02% 4 | -0.16% |
| 1983-3 | -0.64% 1 | -0.14% 2 | 0.75% 3 | 0.01% 4 | -0.03% |
| Avg | -0.44% | 0.12% | 0.35% | 0.29% | 0.33% |
| 1987-3 | -1.68% 1 | -2.48% 2 | 0.76% 3 | 0.75% 4 | -2.65% |
| 1991-3 | 0.94% 1 | 2.15% 2 | 0.79% 3 | -0.01% 4 | 3.87% |
| 1995-3 | 0.81% 1 | 0.43% 2 | 0.45% 3 | 0.50% 4 | 2.19% |
| 1999-3 | 3.04% 1 | -0.50% 2 | -0.76% 3 | 1.30% 4 | 3.08% |
| 2003-3 | 1.92% 1 | 0.44% 2 | 0.27% 3 | 2.21% 4 | 4.83% |
| Avg | 1.01% | 0.01% | 0.30% | 0.95% | 2.26% |
| OTC summary for Presidential Year 3 1963 - 2003 | |||||
| Averages | 0.28% | 0.08% | 0.28% | 0.54% | 1.17% |
| %Winners | 64% | 64% | 64% | 73% | 64% |
| MDD 4/14/1987 4.11% -- 3/25/1975 2.09% -- 3/31/1999 1.26% | |||||
| OTC summary for all years 1963 - 2006 | |||||
| Averages | 0.15% | 0.29% | 0.26% | 0.37% | 1.06% |
| % Winners | 50% | 59% | 68% | 75% | 59% |
| SPX Presidential Year 3 | |||||
| Day4 | Day3 | Day2 | Day1 | Totals | |
| 1955-3 | 0.59% 2 | 0.13% 3 | 0.21% 4 | 0.45% 5 | 1.38% |
| 1959-3 | -0.92% 1 | 0.16% 2 | -0.14% 3 | -0.21% 4 | -1.12% |
| 1963-3 | 0.35% 1 | -0.10% 2 | -0.23% 3 | 0.70% 4 | 0.72% |
| 1967-3 | -0.06% 1 | -0.22% 2 | 0.28% 3 | 0.76% 4 | 0.77% |
| 1971-3 | 0.23% 1 | 0.71% 2 | 0.46% 3 | 0.12% 4 | 1.52% |
| 1975-3 | -2.36% 1 | 0.79% 2 | 1.86% 3 | 0.31% 4 | 0.60% |
| 1979-3 | -0.30% 1 | 0.46% 2 | -1.00% 3 | -0.30% 4 | -1.14% |
| 1983-3 | -0.54% 1 | -0.17% 2 | 1.19% 3 | -0.28% 4 | 0.20% |
| Avg | -0.61% | 0.31% | 0.56% | 0.12% | 0.39% |
| 1987-3 | -2.35% 1 | -2.26% 2 | 1.89% 3 | 0.87% 4 | -1.85% |
| 1991-3 | 0.64% 1 | 1.75% 2 | -0.25% 3 | -0.03% 4 | 2.10% |
| 1995-3 | 0.12% 1 | -0.29% 2 | 0.32% 3 | 0.41% 4 | 0.56% |
| 1999-3 | 2.14% 1 | -0.72% 2 | -1.11% 3 | 0.57% 4 | 0.88% |
| 2003-3 | 1.95% 1 | 0.63% 2 | -1.22% 3 | 1.55% 4 | 2.91% |
| Avg | 0.50% | -0.18% | -0.07% | 0.67% | 0.92% |
| SPX summary for Presidential year 3 1955 - 2003 | |||||
| Averages | -0.04% | 0.07% | 0.17% | 0.38% | 0.58% |
| %Winners | 54% | 54% | 54% | 69% | 77% |
| MDD 4/14/1987 4.56% -- 3/24/1975 2.36% -- 3/31/1999 1.82% | |||||
| SPX summary for all years 1953 - 2006 | |||||
| Averages | 0.04% | 0.14% | 0.07% | 0.23% | 0.49% |
| % Winners | 48% | 54% | 55% | 65% | 65% |
April
During the 3rd year of the Presidential Cycle the OTC has had an average return of 3.7% and been down only once, in 1987. Over all years the index has been up 68% of the time with an average return of 1.5%.
The chart below shows the OTC for an average April over all years in orange and the average April during the 3rd year of the Presidential Cycle in blue.
The number of trading days in April has varied from 19 to 22. The chart shows the average return of the first 11 trading days and the last 10. Dashed vertical lines have been drawn after the 1st trading day and at 5 day intervals. A solid line has been drawn on the 11th trading day.
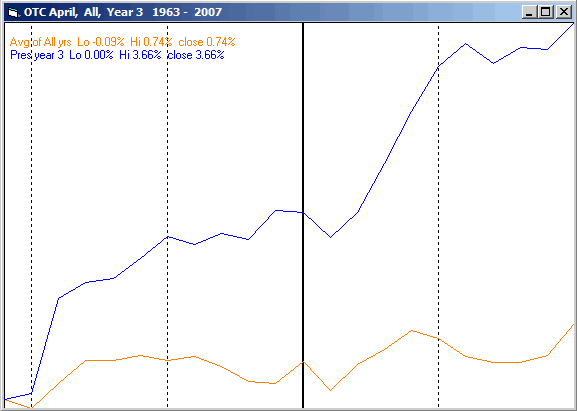
Although the 0.5% gain for the OTC in March was the weakest on record for the 3rd year of the Presidential Cycle, up is up and the record still stands at 100% up.
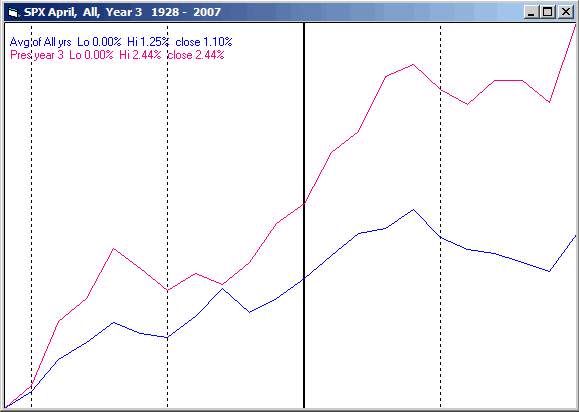
Since 1928 the SPX has been up 58% of the time in April with an average return of 1.1%, however, during the 3rd year of the Presidential Cycle it has been up 78% of the time with an average return of 2.4%. The last time the SPX was down in April during the 3rd year of the Presidential Cycle was 1987.
The chart below is similar to the one above except it shows the SPX.
The Alpha Fund (APHAX)
The Alpha Fund, which I manage, opened last October.
Last week YTD
APHAX -0.2% +2.62%
For information about the fund go to: http://www.thealphafunds.com/index.htm .
The fund now has service class shares available.
Conclusion
Last weeks decline did not cause any technical problems and next week is seasonally very strong.
I expect the major indices to be higher on Thursday April 5 than they were on Friday March 30.
By Mike Burk
Mike Burke is an employee and principle of Alpha Investment Management (Alpha) a registered investment advisor. Charts and figures presented herein are believed to be reliable but we cannot attest to their accuracy. The views expressed are provided for information purposes only and should not be construed in any way as investment advice. Furthermore, the opinions expressed may change without notice. To subscribe to this report : http://alphaim.net/signup.html
© 2005-2022 http://www.MarketOracle.co.uk - The Market Oracle is a FREE Daily Financial Markets Analysis & Forecasting online publication.