Slowing Western economies will force new QE: Trading Setups and Deep analysis
Economics / Global Economy Jul 08, 2019 - 03:07 PM GMTBy: QUANTO
 The world is slowing down dramatically. At the same time, the largest economy is hurtling towards an election. Al governments who go to election will try to massage the numbers and pump the stock markets. So while the economy slows, the governmment is buzy pumping markets higher with his tweets.
The slowing down economy can be seen in numerous metrics and we believe central banks will be forced to begin a new round of QE. This time they will need to face up to inflation even as they pump in money.
Key metrics and charts shown below.
Germany Construction PMI
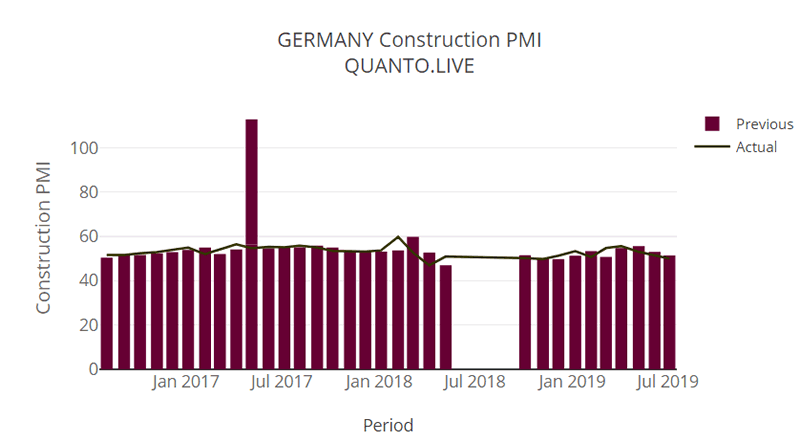
Construction PMI reported at 50.0 is lower than the previous release at 51.4. The mean for " Construction PMI " over the last 33 releases is 53.2. The current actual data is lower than the mean of the last 33 releases. The last reported data was on 2019-07-04
US ISM Employment Index
Crude Inventory
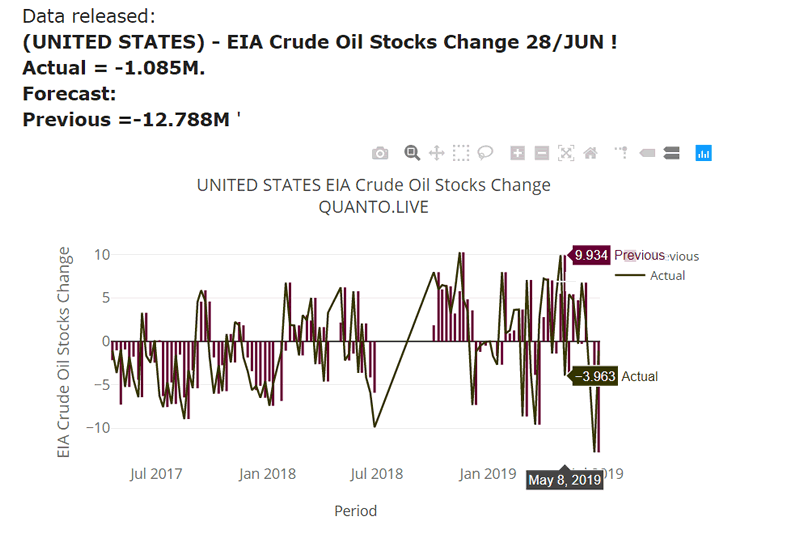
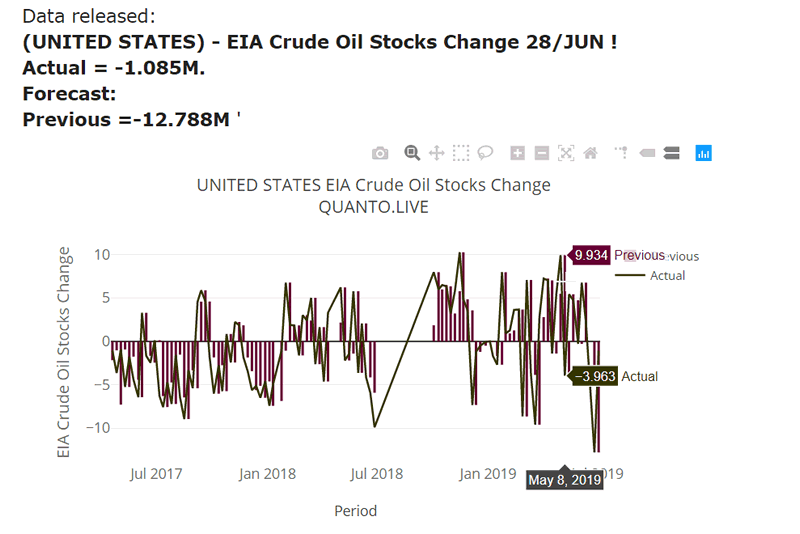
The current actual data at -1.085 is higher than the previous release at -12.788. There is a larger drawdown than expected. The mean for " EIA Crude Oil Stocks Change " over the last 100 releases is -0.4. The current actual data is lower than the mean of the last 100 releases. The last reported data was on 2019-07-03
Factory orders: Dip in June
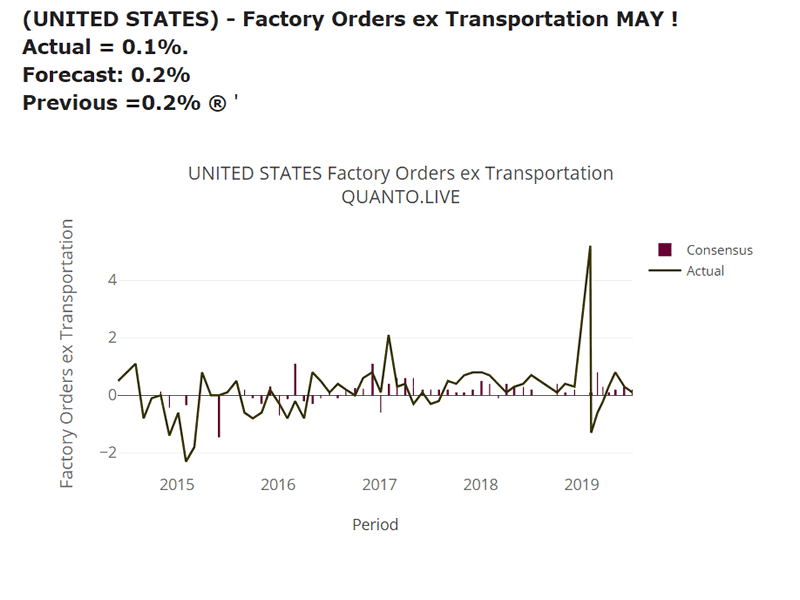
Trump Tariff war is having a slowing effect on factory orders. Things are going to get worse a factory orders have an impact on hiring and then on the larger economy. The current actual data at 0.1 is lower than the previous release at 0.2. The mean for " Factory Orders ex Transportation " over the last 61 releases is 0.1. The current actual data is lower than the mean of the last 77 releases. The last reported data was on 2019-07-03.
ISM Prices
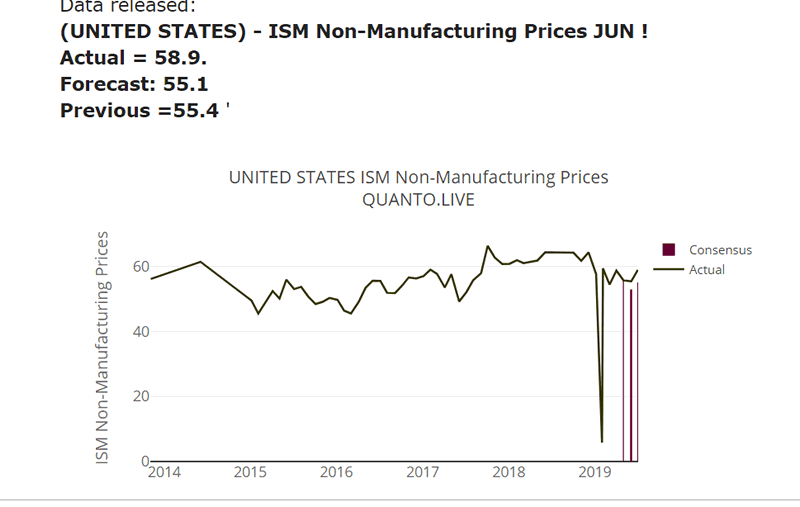
Pirce ticked higher even as activity slowed down. The current actual data at 58.9 is higher than the previous release at 55.4. The mean for " ISM Non-Manufacturing Prices " over the last 55 releases is 54.8. The latest release is greater than the mean of the last 55 releases. The last reported data was on 2019-07-03.
ISM Nonmanufacturing new orders
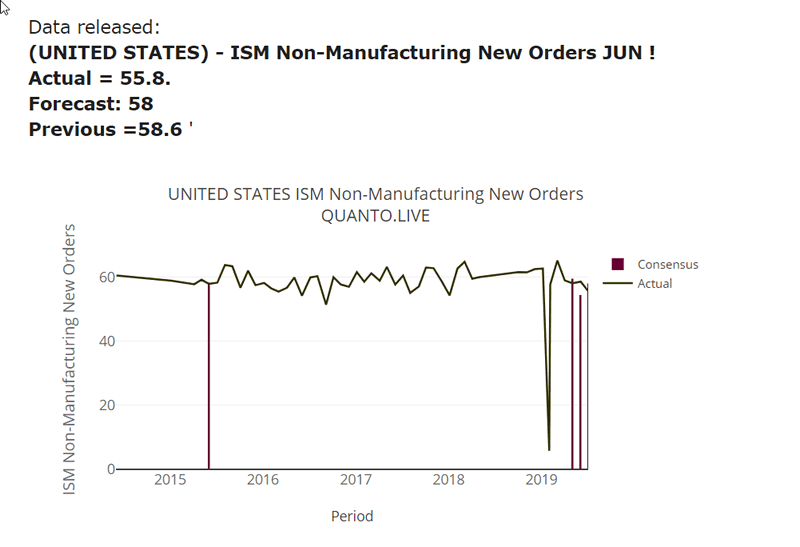
Not only is factory order suffering, the new orders for non-manufacturing section is also slowing down. Data came in at 55.8 lower than the previous release at 58.6. The mean for " ISM Non-Manufacturing New Orders " over the last 53 releases is 58.4. The current actual data is lower than the mean of the last 53 releases.
Non Manufacturing Business Activity
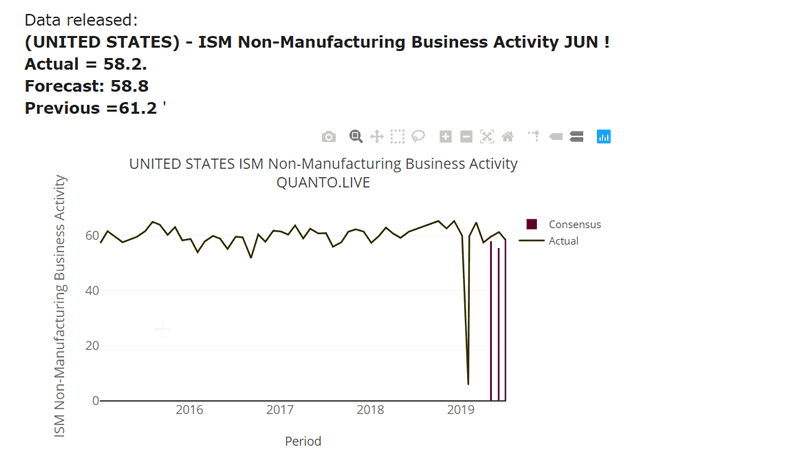
Business activity slowed down in the non-manufactring sector.The current actual data at 58.2 is lower than the previous release at 61.2. The mean for " ISM Non-Manufacturing Business Activity " over the last 52 releases is 59.1. The current actual data is lower than the mean of the last 52 releases.
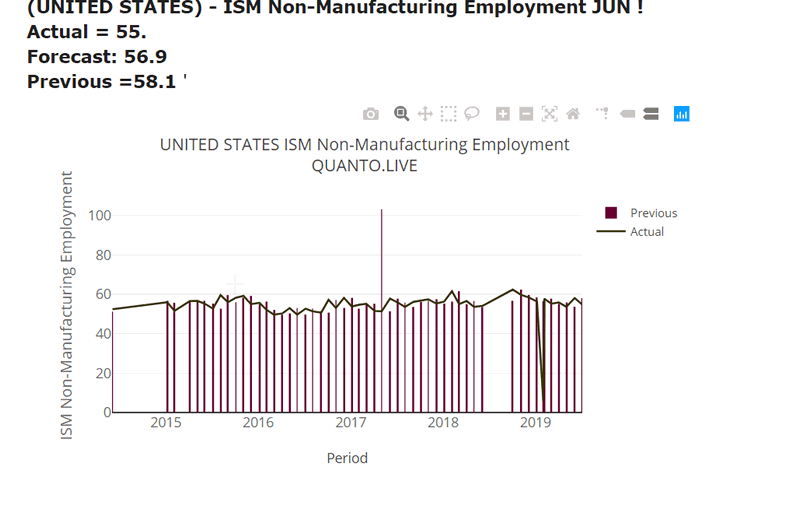
ISM Employment in Nonmanufacturing
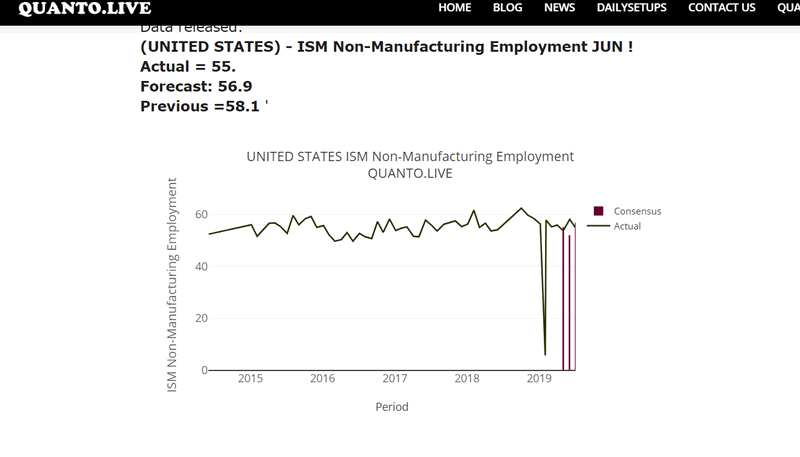
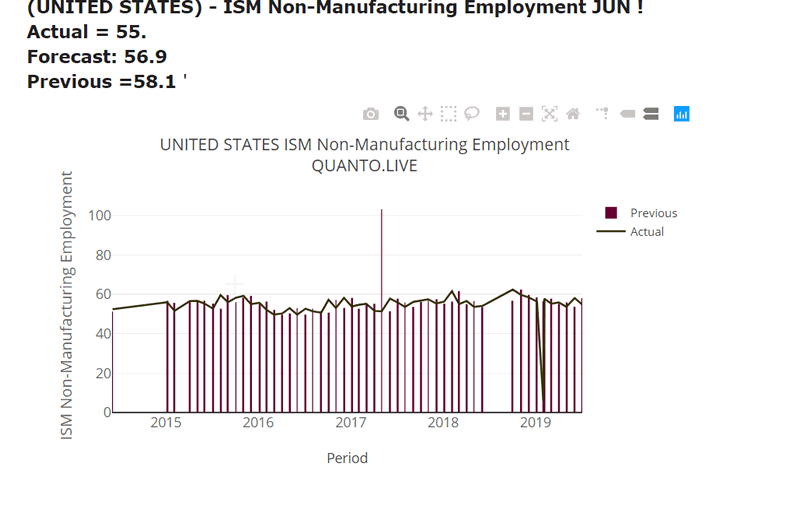
One of the most important indices within the ISM report is the employment index. It ticked lower in June. Data came in at 55 is lower than the previous release at 58.1. The mean for " ISM Non-Manufacturing Employment " over the last 54 releases is 54.3. The latest release is greater than the mean of the last 54 releases. The last reported data was on 2019-07-03
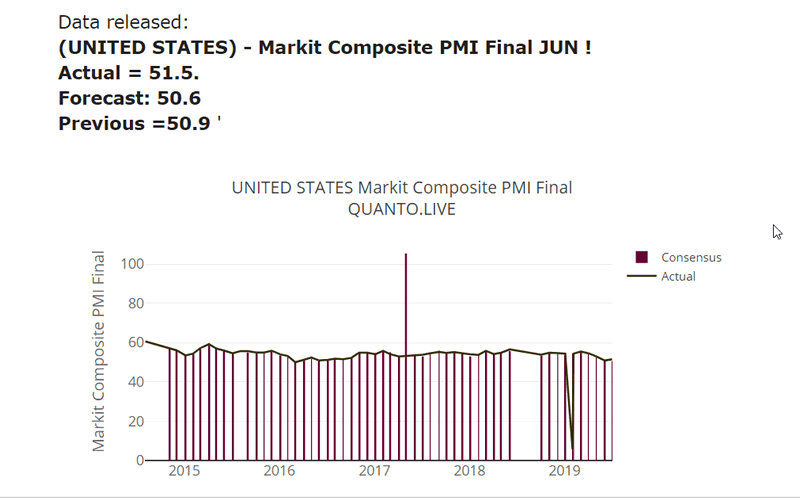
The PMI shows the weakening trend in business activity and survey.
UK Car registration On the other side of atlantic, UK is slowing down far faster than any other G7 economy. We just look at one parameter here and leave the more detailed one later.
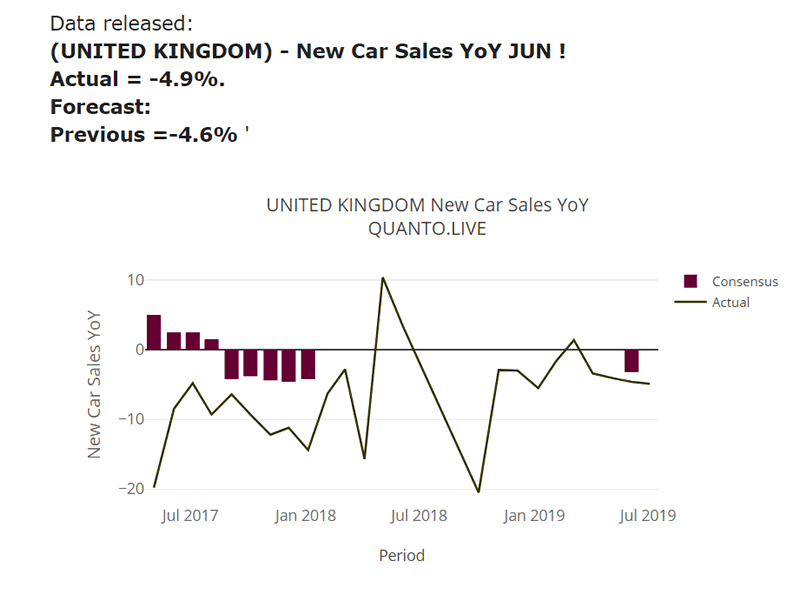
The current actual data at -4.9 is lower than the previous release at -4.6. The mean for " New Car Sales YoY " over the last 25 releases is -7.0. The latest release is greater than the mean of the last 25 releases. The last reported data was on 2019-07-04
Fundamentally, we do see a major slowdown in US, UK and EU. We have not looked at Asia but generally Asian economies feed upon the western counterparts. Central banks will have to restart their QE programs and this time its effect will be much lower.
Dollar Index is at resistance and it could dip lower.
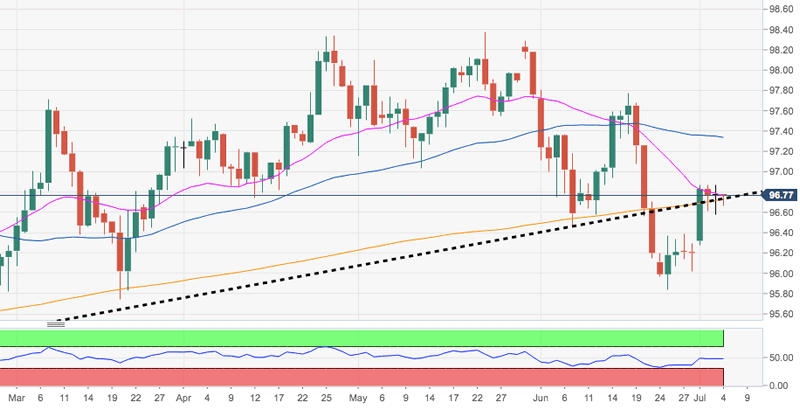
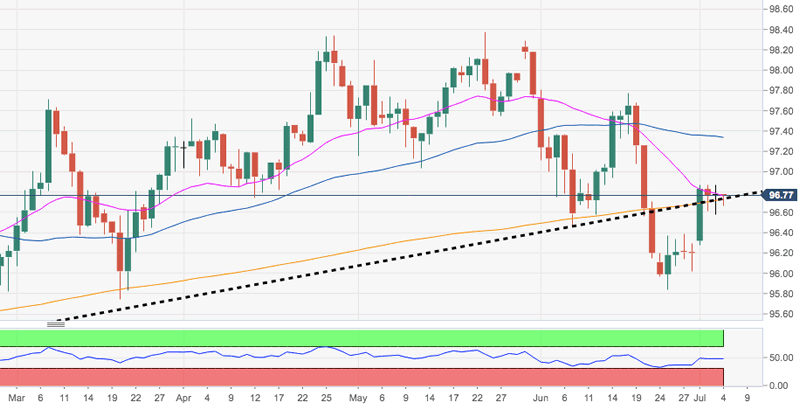
DXY is trading a tad below recent tops in the boundaries of 96.90, challenging the critical support at the 200-day SM in the 96.60 region. This significant area of contention is also reinforced by the multi-month resistance line, today at 96.73. Immediately above emerges the 100-day SMA at 97.08 ahead of the 55-day SMA at 97.31, considered interim hurdles and the last defence of a test of June tops near 97.80.
Crypto Charts
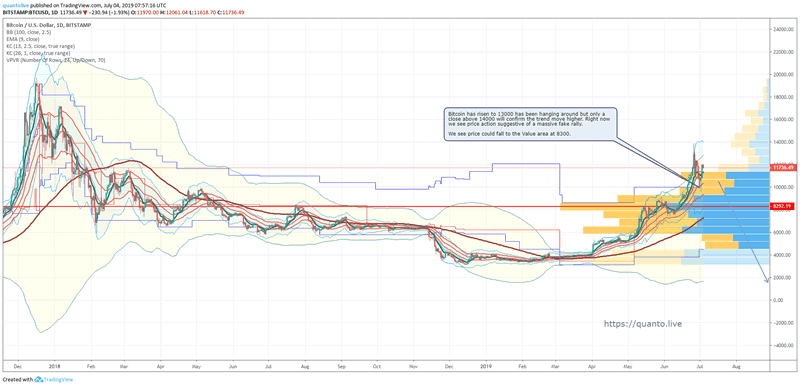

Bitcoin on normal candlestick daily shows a price action which looks tired and unwilling to push higher. But on the renko charts free of much of the noise, the uptrend is solid and pushing teh outer boundary of the bollinger bands. Only under 10000 can bitcoin be considered for shorting.
USD/CAD
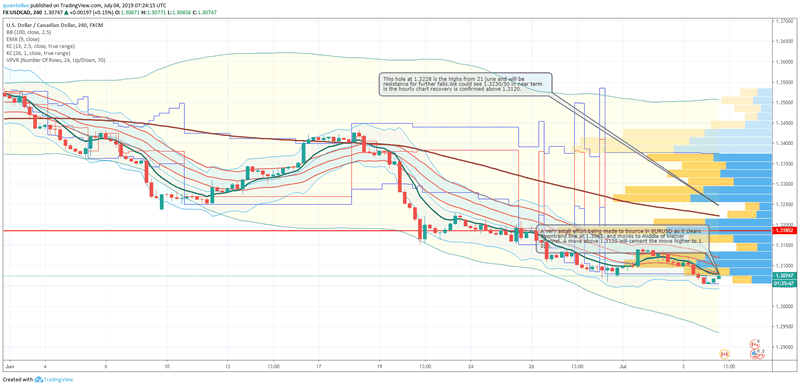
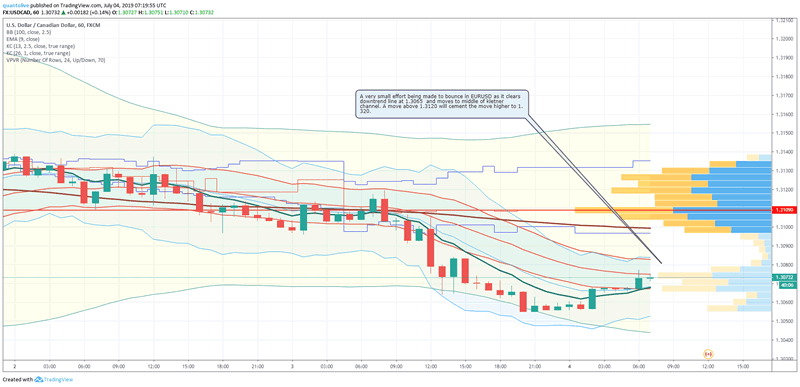
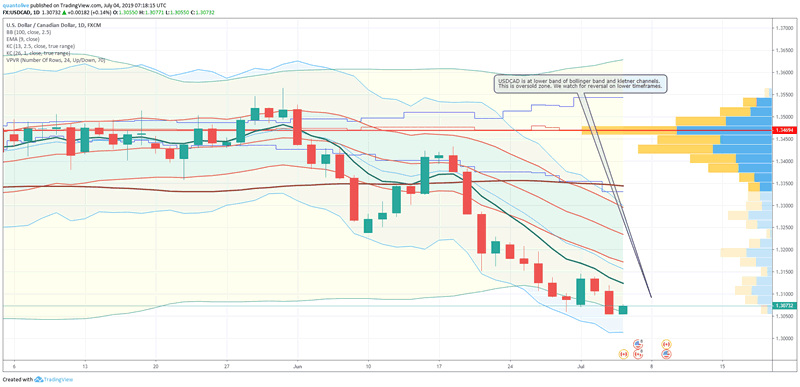
The USD/CAD pair dropped to fresh nine-month lows on Thursday, albeit now seemed to have found some support ahead of mid-1.3000s. The mentioned support nears Nov. 2018 swing lows and should now act as a key pivotal point for the next leg of a directional move. Given the recent bearish break below important confluence support – comprising of the very important 200-day SMA and 5-1/2-month-old ascending trend-line, bearish traders are likely to maintain their dominant position. However, technical indicators on the daily chart have moved on the verge of falling into the oversold territory, which might eventually turn out to be the only factor holding investors from placing any aggressive bearish bets. Sustained weakness below the mentioned support will confirm a fresh near-term bearish breakdown, though traders are likely to wait for Friday’s important releases of monthly jobs report from Canada and NFP from the US. A follow-through selling now seems to turn the pair vulnerable to accelerate the slide further towards challenging the key 1.30 psychological mark before the bearish momentum gets extended further towards the 1.2970-65 region. On the flip side, attempted recoveries might now confront immediate resistance near the 1.3100 round figure mark and any subsequent up-move seems more likely to remain capped near weekly tops, around the 1.3140-45 supply zone.
AUDUSD setups
The prevalent USD selling bias helped build on the recent up-move. Bulls seemed rather unaffected by softer Aussie retail sales figures. Fading US-China trade optimism capped gains amid thin trading. The AUD/USD pair failed to capitalize on its early uptick to near two-month tops and has now retreated to the lower end of its daily trading range, around the 0.7030 region. The pair continued gaining positive traction for the third consecutive session on Thursday and built on the post-RBA bounce from 50-day SMA amid the prevalent US Dollar selling bias. The ongoing slide in the US Treasury bond yields to their lowest level in more than 2-1/2 year lows kept the USD bulls on the defensive and remained supportive of the recent up-move. The buck was further pressurized by Wednesday's disappointing US macro data, showing that the US private-sector employers added less-than-expected 102K jobs in June while the ISM non-manufacturing PMI fell to 55.1 as compared to 55.9 expected and 56.9 previous, which reinforced market expectations that the Fed will eventually cut interest rates in July.
GBPUSD Setups
GBP/USD pair continues to hold below the 1.2763/72 resistance (the 7th June high and February low) and they maintain a slightly negative bias. The Elliott wave count on the daily chart is negative implying that the market is likely to slide back towards the 1.2559/1.2506 recent lows. Below 1.2506 would target the 1.2444 December 2018 low. This is the last defence for 1.2108, the 78.6% retracement of the move up from 2016. The market will have to overcome last weeks high at 1.2784 on a closing basis in order to generate some further upside interest. This will target the 200 day ma at 1.2913, but we are looking for this to then cap the topside.
In a world where fundamentals and technicals and Twitter feeds are driving the markets, it is important to be cautious in trading. We use QUANTO trade system to trade forex. It is the most profitable trading system in the world and generated considerable wealth.
QUANTO TRADE COPIER The Trade history performance is shown below. The current performance can be checked at https://quanto.live
QUANTO is a trading system which combined Market Profile Theory and Kletner channels. It is hugely profitable. There was a trader back in If you would like to start right away, please contact us. Our email: Partners@quanto.live
By Quanto
Quanto.live is a Investment Management firm with active Trading for clients including Forex, Crypto. We send our trades via trade copiers which are copied to clients trading terminals. Top notch fundamental analysis and trading analysis help our clients to generate superior returns. Reach out to us: http://quanto.live/reach-us/
© 2019 Copyright Quanto - All Rights Reserved Disclaimer: The above is a matter of opinion provided for general information purposes only and is not intended as investment advice. Information and analysis above are derived from sources and utilising methods believed to be reliable, but we cannot accept responsibility for any losses you may incur as a result of this analysis. Individuals should consult with their personal financial advisors.
© 2005-2022 http://www.MarketOracle.co.uk - The Market Oracle is a FREE Daily Financial Markets Analysis & Forecasting online publication.


